Heatmap: Plan Statistics
This page describes the Plans Statistics tab that allows heatmap generation on plan layouts to visualize activity patterns over selected time frames and view heatmap plan statistics.
Overview
Select the Plan Statistics tab in the tabs menu:
Use and Functionality
The Plans Statistics functional menu allows to:
- Select the single desired plan from the drop-down list
- Choose multiple required object types from the drop-down list
- Select the desired time frame to generate a heatmap
- Click the Report button to start filtering
- Click the Reset button to clear the filters
- Selection of the Plan and Time Frame parameters is mandatory for generating a heatmap. Without these selections, the heatmap will not be generated.
- The process of generating a heatmap report may take a significant amount of time due to the potentially large size of the analytics data.
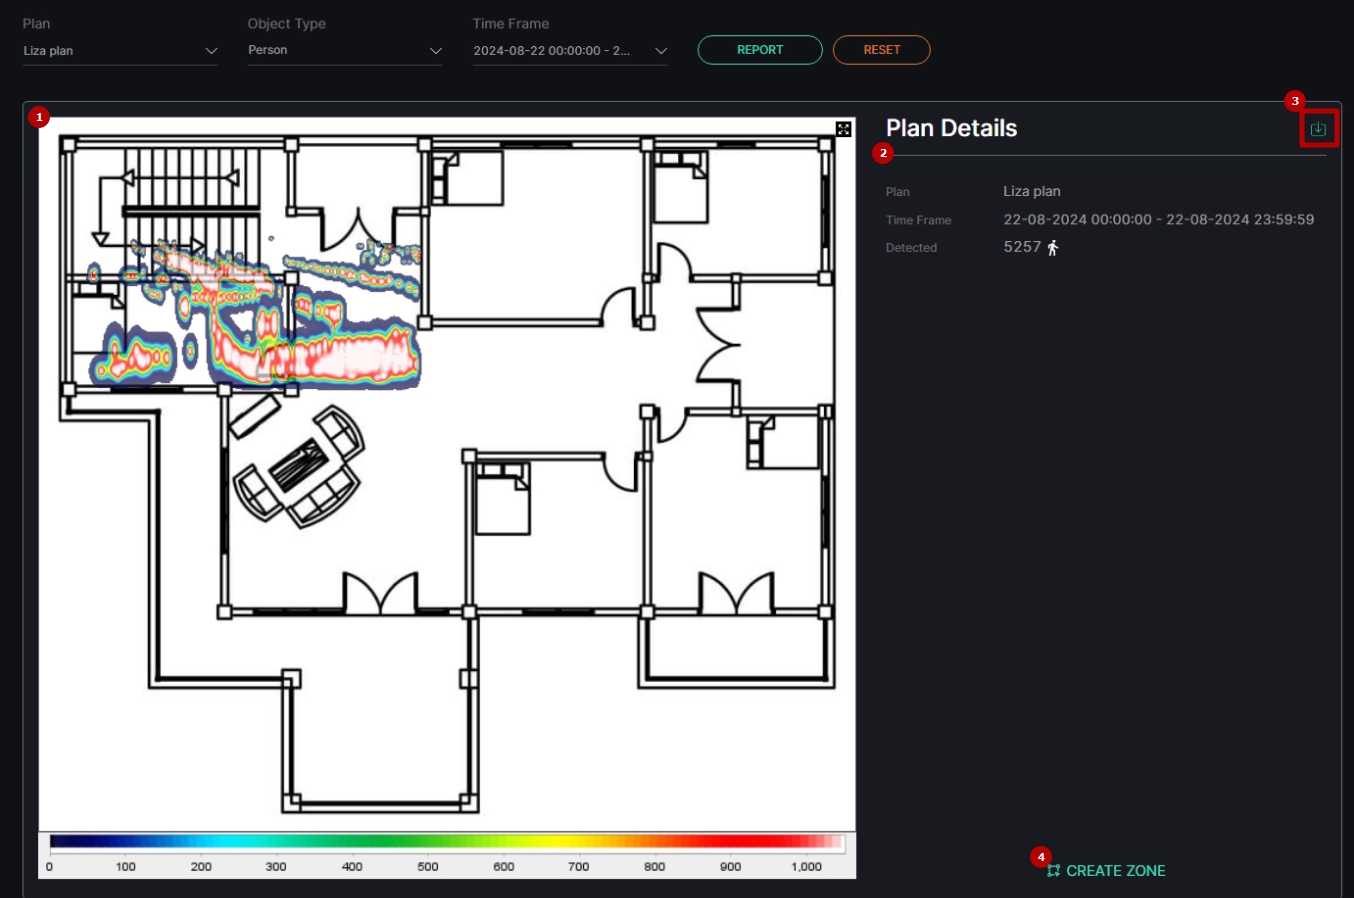
Once selected and filtered, in the generated heatmap plan statistics:
- View the heatmap overlay on the plan, with a color legend displayed at the bottom, indicating activity levels. Left-click the plan to change the view mode:
- Plan image opacity 100% + heatmap (default mode)
- Plan image opacity as set in the plan's settings + analytics' camera frame previews with opacity as set in the plan's settings + heatmap
- Plan image opacity as set in the plan's settings + analytics' camera frame previews with opacity as set in the plan's settings
- See relevant plan details, including the selected criteria and detection statistics
- Click the Save Image icon to download the current plan with the heatmap overlay
- Click the Create Zone button to define a specific area within the plan, enabling more targeted heatmap statistics
- Heatmap statistics only include data from moving objects. Static objects are excluded from these statistics.
- The Enlargement icon in the top-right corner of the frame allows opening the image in full-screen mode. Press the Esc key on the keyboard to return to the standard view.
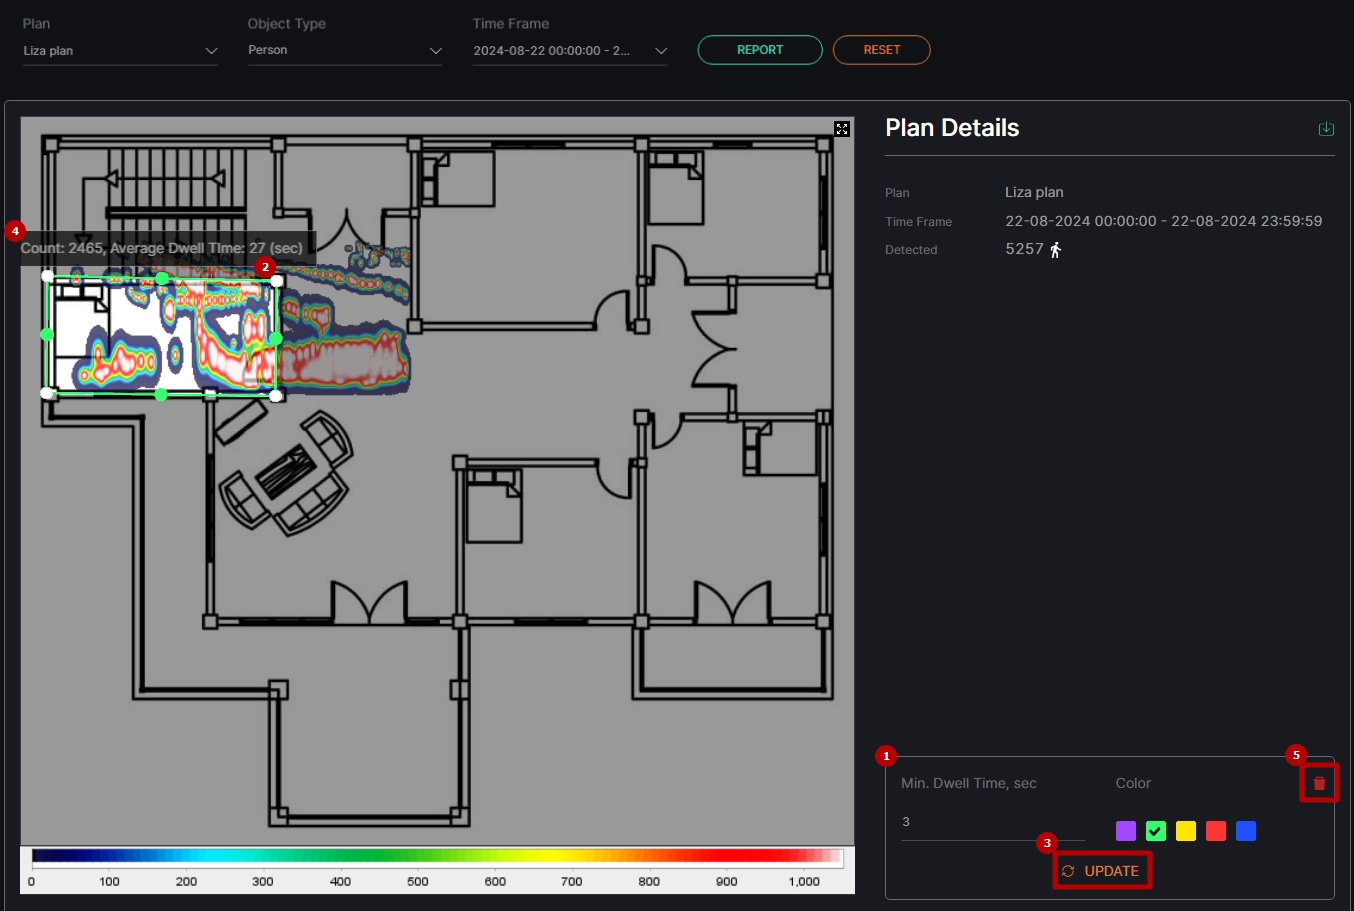
To see the more targeted heatmap statistics, after clicking the Create Zone button, proceed with the following settings:
- Set the zone parameters:
- Enter the minimum dwell time in seconds for objects' minimum presence time inside the zone
- Select the color of the zone borders
- Modify the zone:
- Click and drag the handles with LMB to set the zone borders
- Click and drag the area inside the zone with LMB to move the whole zone
- Click the handle with RMB to delete it
- Click the Update button to calculate the object count inside the zone that meets the set parameters
- See the total object count inside the zone and their average presence time
- Click the red Delete icon to delete the zone
The zone can be edited and updated as many times as needed to display different statistical data in the Count and Average Dwell Time parameters.


