Traffic Analytics: Analytics
Overview
To open the Analytics item, in the left menu:
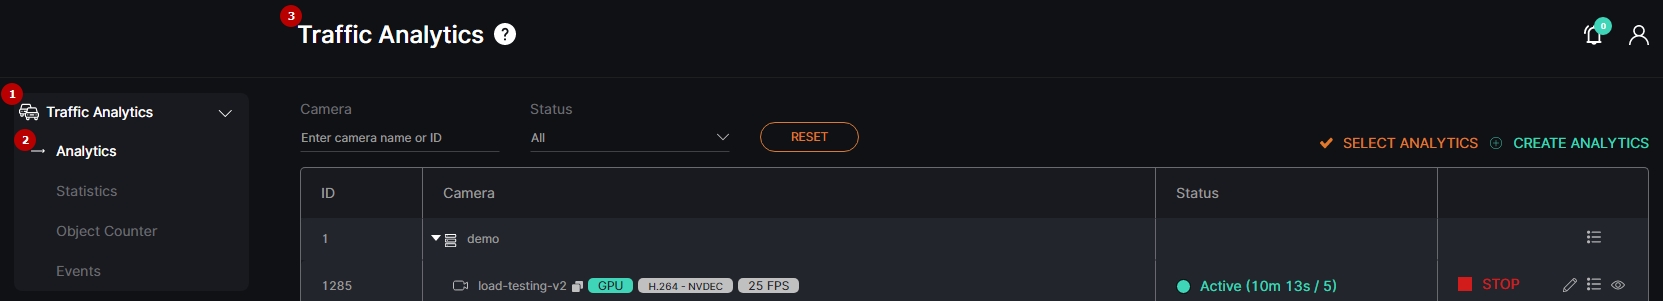
- Select the Traffic Analytics section
- Choose the Analytics item
- See analytics
Use and Functionality
The Traffic Analytics functional menu allows to:
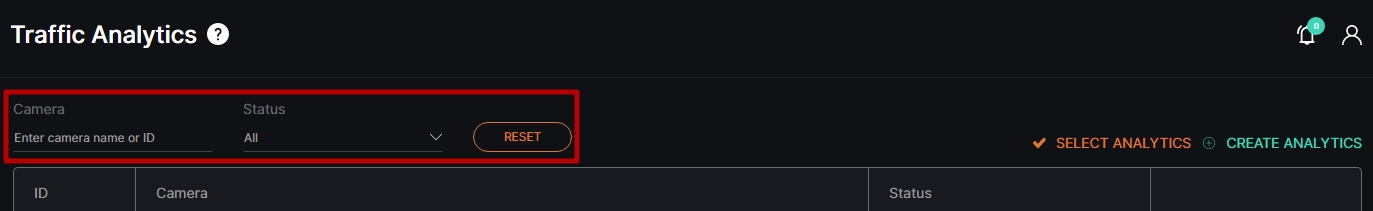
- Fill in the Camera field with:
- Camera name or characters in the name
- Analytics ID
- Video stream ID
- Select the required analytics status
- Click the Reset button to clear the filters
See the list of analytics in the table below. It contains:
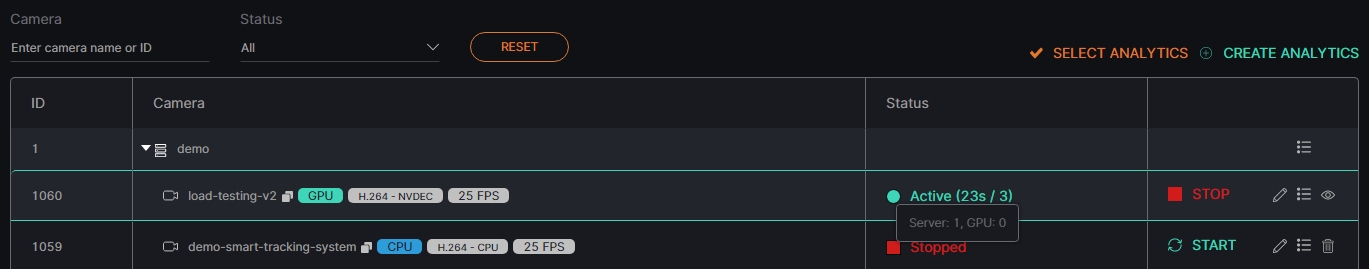
- Analytics and folders ID
- Camera comprises:
- Folders' and separate video streams' names
- Copy Name icon to copy the video stream name
- Video source type
- Additional hardware parameters
- Video stream or video file playback status. For the Active and Offline statuses, the system also displays:
- Countdown since analytics launch
- Last server connection to analytics (seconds ago)
- Toolbox comprises:
- Start/Stop
- Edit
- Events
- View
- Delete
- To learn more about grouping video streams into folders and making the appropriate changes in the Video Streams item, read Video Streams.
- To find out the ID of the CPU/GPU and the server running the video stream, hover the mouse over the circle next to the status of the running analytics.
Create Analytics
To create new analytics, click the Create Analytics button:
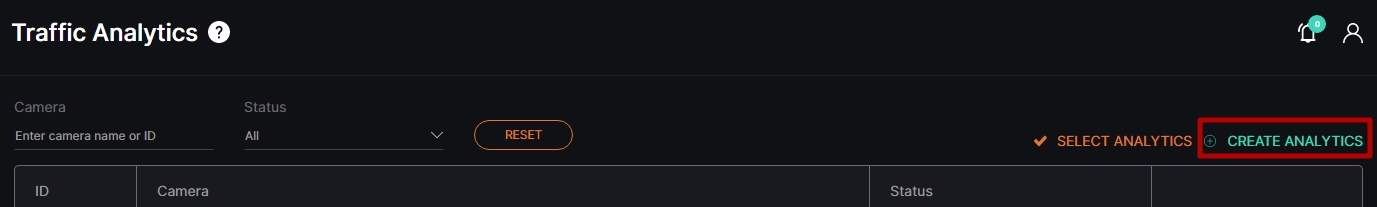
The Create Traffic Analytics navigation menu allows to:
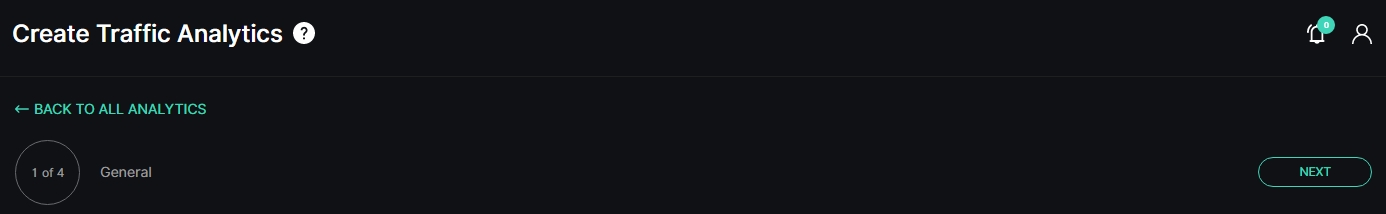
- Click the Back to All Analytics button to return to the main Analytics item
- See the title and serial number of the current tab
- Click the Back or Next button to move among tabs:
- General
- Hardware
- Notifications
- Permissions
General Tab
The General tab provides the ability to set a video stream and customize analytics parameters.
To set a video stream:
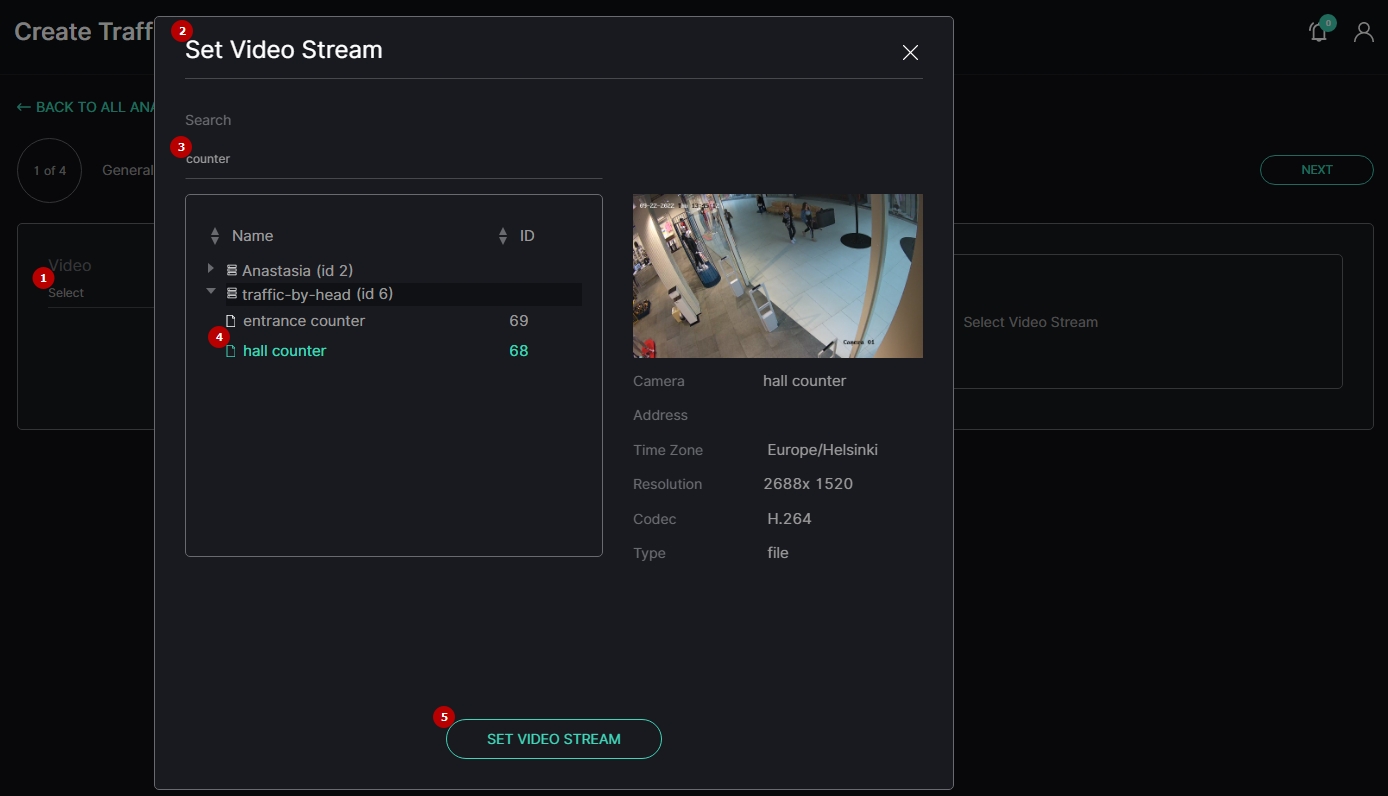
- Click the Video field
- See the Set Video Stream pop-up window
- Fill in the Search field with:
- Camera name or characters in the name
- Video stream ID
- Select the required camera from the filtered list
- Click the Set Video Stream button to confirm the intention
Recognition Options
To perform the recognition, apply these recognition options:
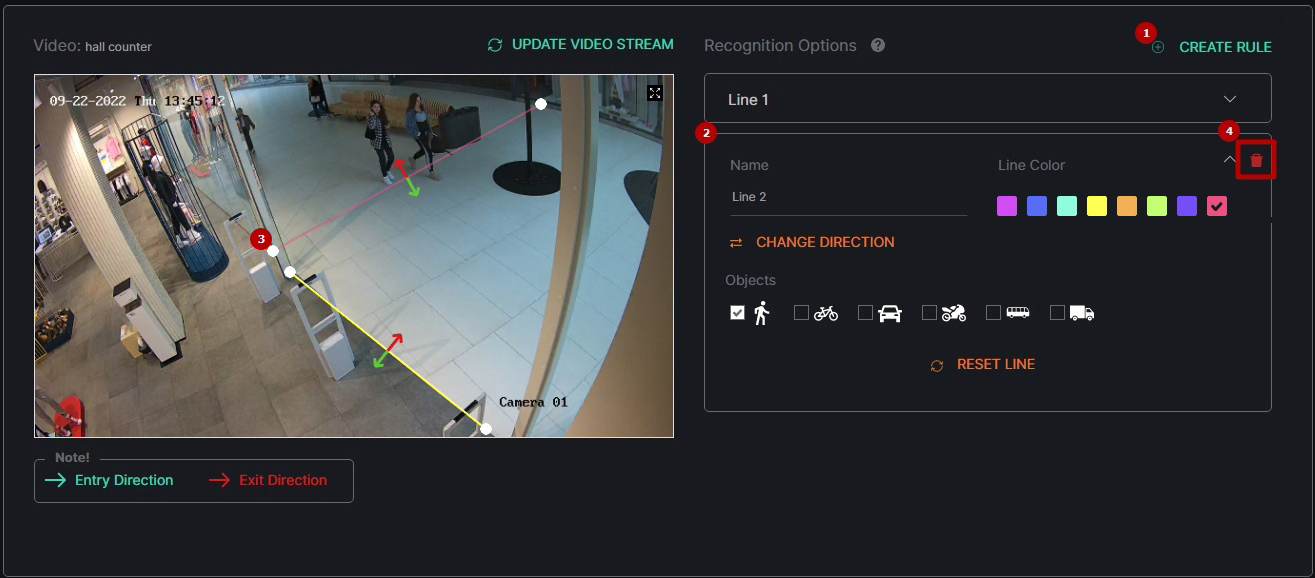
- Select the Create Rule button to create a new rule
- Set the parameters:
- Enter the line name
- Select the line color
- Redirect the traffic by clicking the Change Direction button
- Select the required checkboxes to set objects
- Modify the line:
- Click and drag the handles with LMB to set the line size and location
- Click and drag the line with LMB to move the whole line
- Click the Reset Line button to return the line to its original position
- Select the red Delete icon to delete the required rule section
Hardware Tab
The Hardware tab provides the ability to customize hardware parameters:
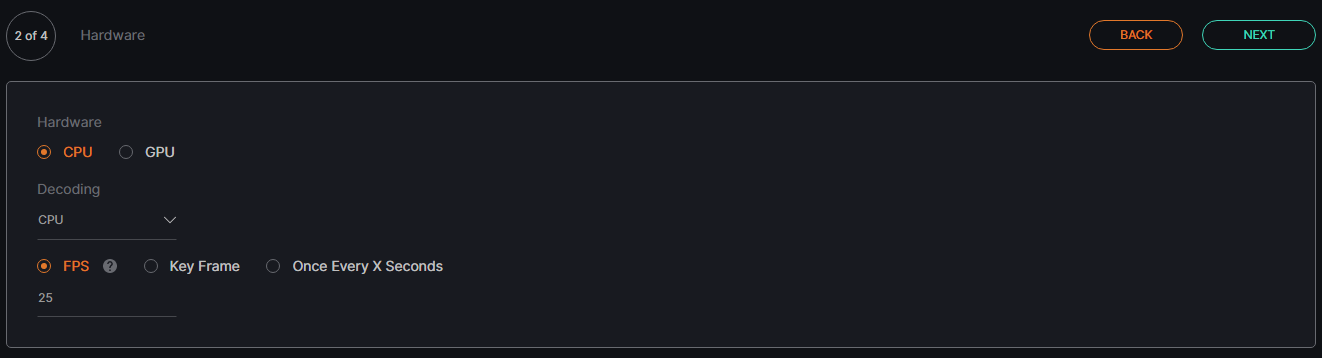
- Choose the CPU or GPU hardware acceleration
- Select the hardware decoder from the drop-down list:
- CPU
- Intel
- NVDEC
- Select the frame processing mode:
- FPS to set the desired number of frames per second
- Key Frame to set the frame processing only by keyframes
- Once Every X Seconds to set intervals in seconds between frame processing
- The recommended value for the FPS mode is 25.
- The default parameters allow the production of analytics. To customize the analytics, set parameters as required.
- To learn more about hardware settings, read How to Сonfigure the Hardware Tab Settings.
The Notifications tab allows managing the events notifications:
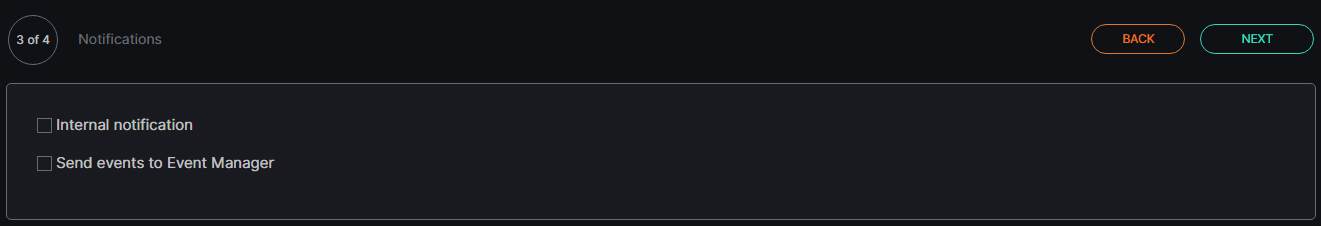
- Check the Internal Notification box to allow the system to send all notifications to the Events section
- Check the Send Events to Event Manager box to allow the system to send all notifications to the Event Manager and then to external resources
Once the Internal Notification box is checked, and the analytics is created and enabled, the Notification icon signals about each new event notification. Click the Notification icon to open the Notification Panel. It comprises:
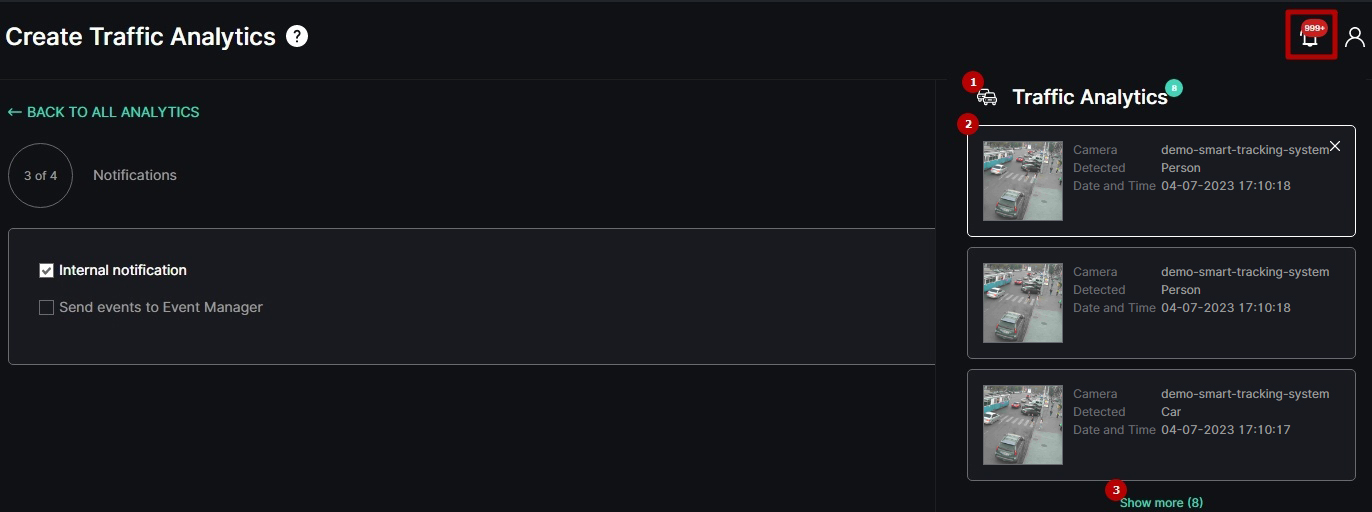
- Plugin name box to:
- Collapse/expand the list of event notifications by clicking the plugin name
- Clear all plugin event notifications at once from the Notification Panel by clicking the Close button (this action doesn't affect events in the Events item)
- Event notification box to:
- View short event information and frame preview for up to 3 last notifications
- Open the event pop-up window by clicking the required notification
- Clear the desired event notification from the notification list by clicking the Close button inside the box (this action doesn't affect the event in the Events item)
- Show More button with the total events number to open the Events item and view all events
Permissions Tab
The Permissions tab provides the ability to:
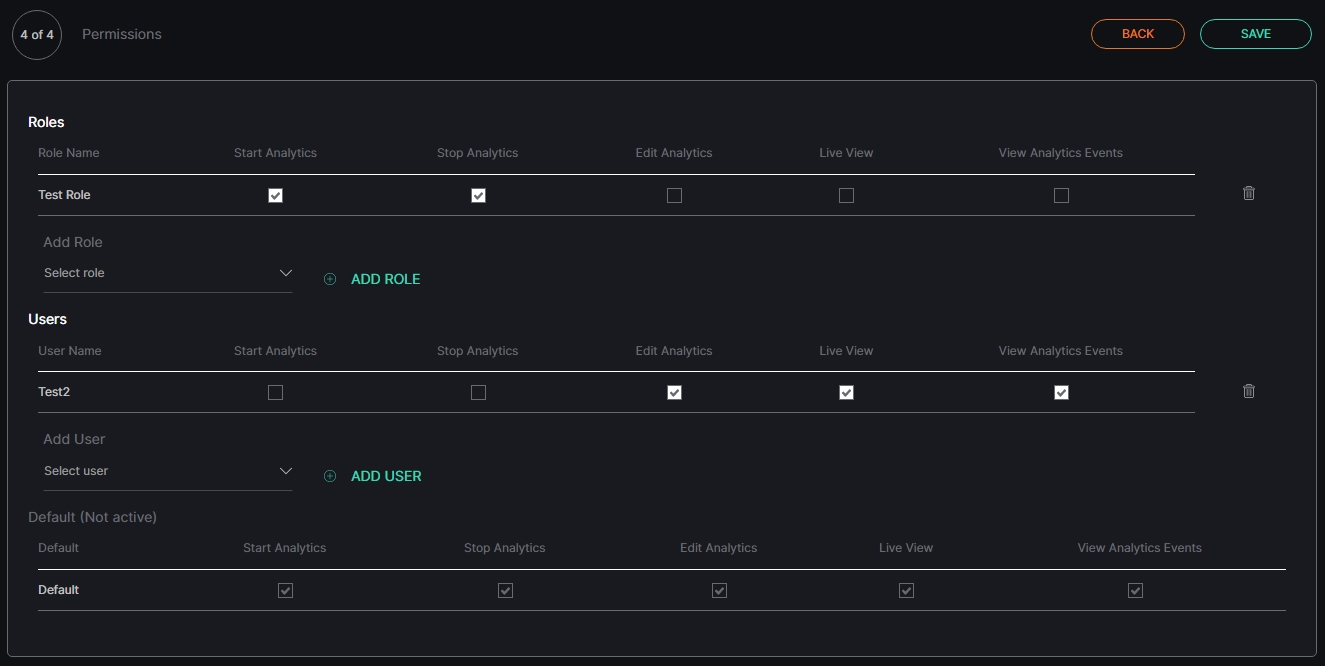
- Assign analytics access rights for Roles:
- Select the required role from the drop-down list
- Click the Add Role button
- Select the checkboxes for the required access rights
- Click the Delete icon to remove the unnecessary role
- Assign analytics access rights for Users:
- Select the required user from the drop-down list
- Click the Add User button
- Select the checkboxes for the required access rights
- Click the Delete icon to remove the unnecessary user
- Select the checkboxes for the required analytics access rights by default
- Select the Save button to confirm the intention in the navigation menu
- The default parameters are active only if no Roles or Users are added.
- The quantity of added Roles and Users is not limited.
Once saved, the Traffic Analytics editor opens to allow the users to:
- Modify parameters
- Set parameters
- Run the created analytics
- Proceed to live view mode
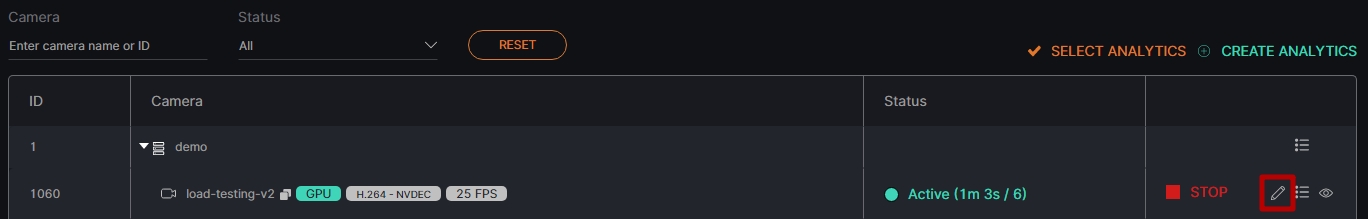
Edit Analytics
To edit settings in the selected analytics, click the Edit icon on the toolbox:
The Edit Traffic Analytics navigation menu allows to:
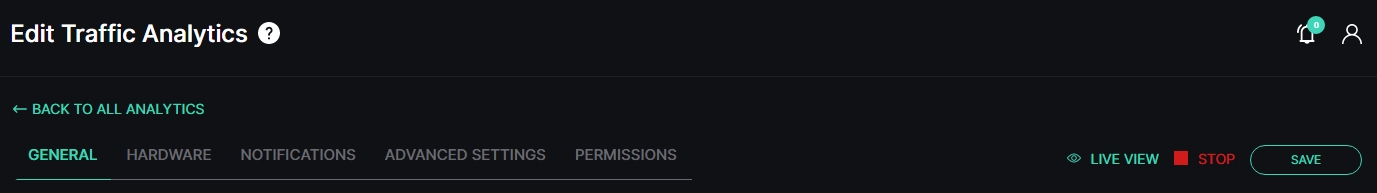
- Click the Back to All Analytics button to return to the main Analytics item
- See the setting tabs and move among them by clicking their titles:
- General
- Hardware
- Notifications
- Advanced Settings
- Permissions
- Select the Stop button to disable the analytics:
- Yes to confirm the analytics disabling
- No to cancel the intention or close the pop-up window
- Select the Start button to enable the analytics
- Click the Live View button to see the selected analytics process in real-time
- Select the Save button to apply the changes to the selected analytics
- The current tab is always highlighted.
- Analytics editing is available only when selected analytics is disabled.
- The Stop button is available only when the current analytics is active.
- The Start button is available only when the current analytics is stopped.
- The Live View button is available only when the current analytics is active.
To view editing parameters for the General, Hardware, Notifications, and Permissions tabs, read Create Analytics.
Advanced Settings Tab
The Advanced Settings tab allows the users to:
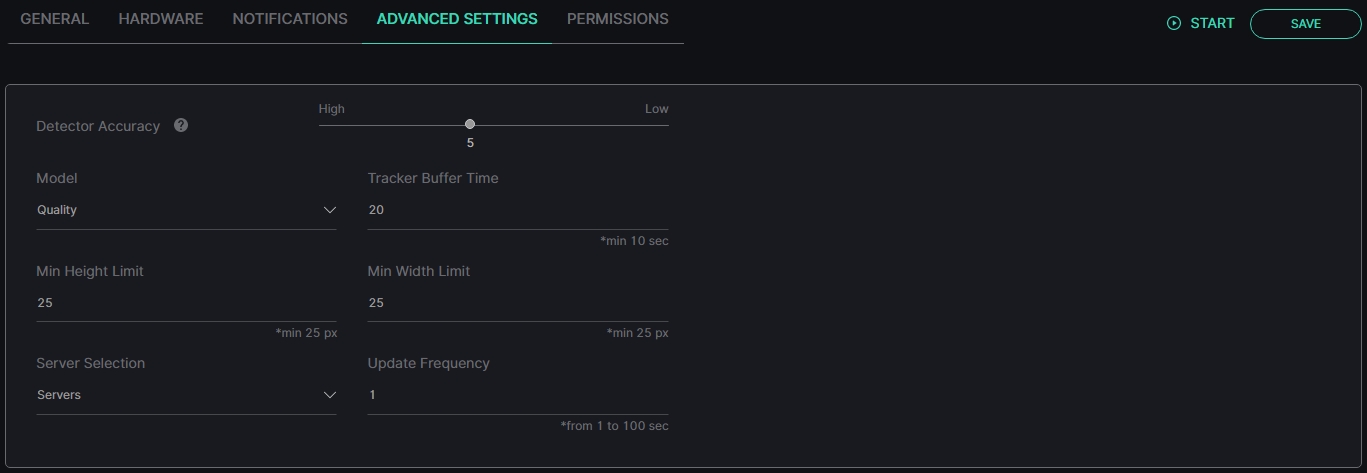
- Move the slider to the left (to increase) or to the right (to decrease) the detector accuracy
- Select an analytics model:
- Quality
- Performance
- Head Recognition
- Enter the recognized object storage time in the buffer (in seconds)
- Set the minimum height of an object for recognition (in pixels)
- Set the minimum width of an object for recognition (in pixels)
- Select a server from the drop-down list to run the analytics
- Enter the interval between analytics data updates in seconds
- The Detector Accuracy setting is determined by the parameters of the original image. A High value is recommended for a low-quality image to increase the detection probability, and a Low value is better for a high-quality image to avoid false detection. The possible range is 2 to 8, the value is 5 by default.
- The Quality model provides exceptional detection quality at the expense of analytics performance.
- The Performance model provides exceptional analytics performance at the expense of detection quality.
- The Head Recognition model uses the head detector, as opposed to the Quality and Performance models which use the body detector.
- The minimum value for the Tracker Buffer Time parameter is 10 sec. The default value is 20 sec.
- The minimum value for the Min Height Limit is 25 pixels. The default value is 25 pixels. The maximum value is limited by the frame height.
- The minimum value for the Min Width Limit is 25 pixels. The default value is 25 pixels. The maximum value is limited by the frame width.
- The possible range for the Update Frequency parameter is 1 to 100 sec.
- Default parameters allow the production of analytics. To customize the analytics, set parameters as required.
Analytics Status
To enable or disable the analytics and view the change in the analytics status:
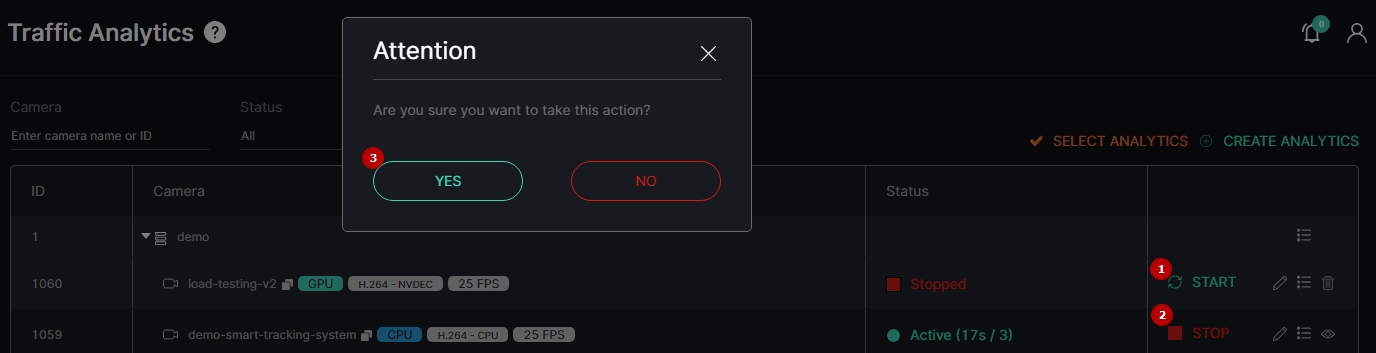
- Select the Start button to enable the analytics
- Click the Stop button to disable the analytics process
- Confirm the intention
To enable or disable multiple analytics at once, click the Select Analytics button:
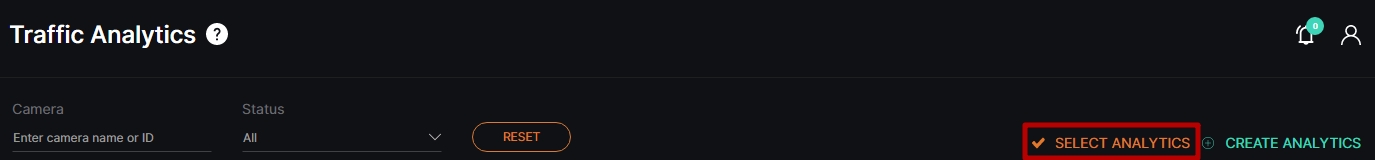
The Select Analytics functional menu allows to:
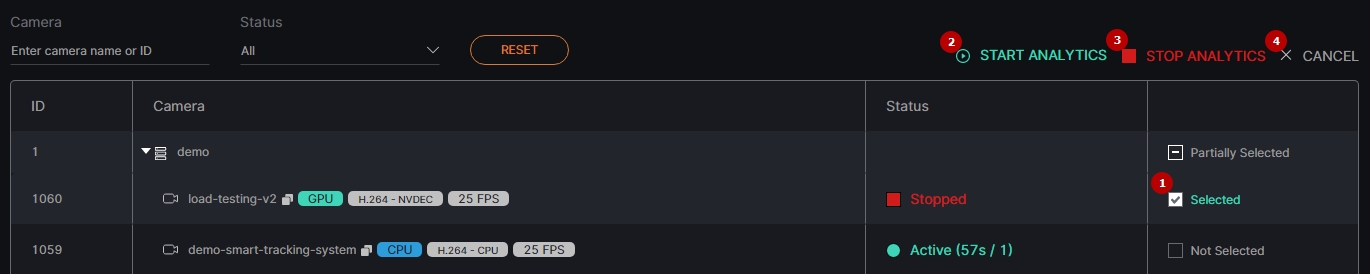
- Check the boxes next to the required folders or separate analytics to select them
- Click the Start Analytics button and confirm the intention in the pop-up window to enable all selected analytics
- Click the Stop Analytics button and confirm the intention in the pop-up window to disable all selected analytics
- Click the Cancel button to quit the analytics selection
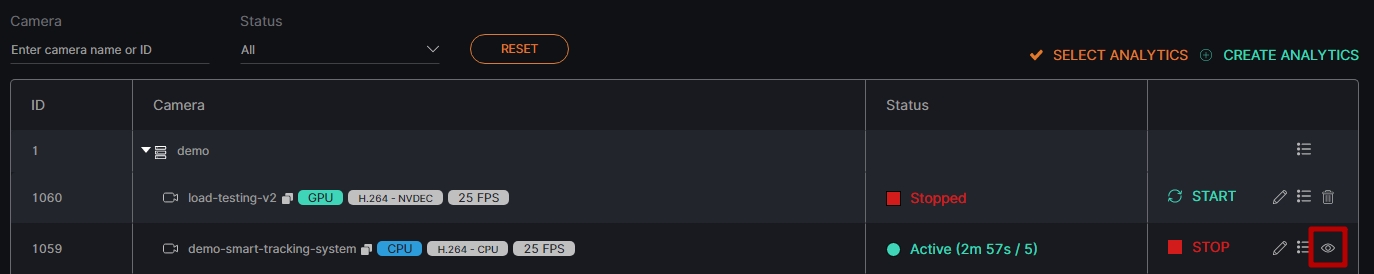
View Analytics
To see the selected analytics in real-time, click the View icon on the toolbox:
Live view analytics mode allows to:
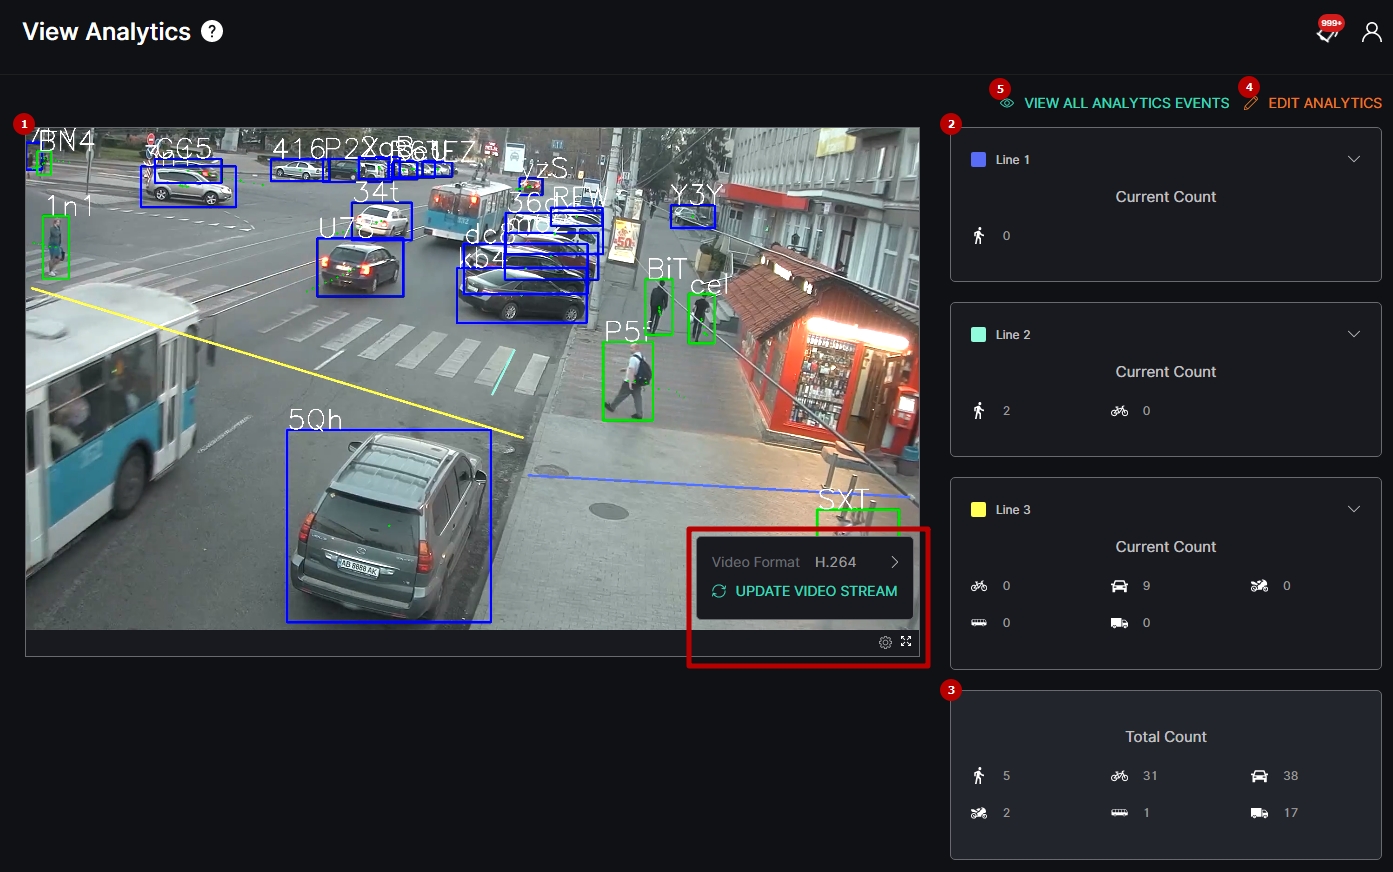
- View the video from the camera in real-time mode. At the bottom of the block:
- Hover the mouse over the Settings icon to:
- Select the desired video format
- Click the Update Video Stream button to manually update the video
- Click the Enlargement icon to expand the video to full screen
- Hover the mouse over the Settings icon to:
- See the current object count for each set line
- See the total amount of objects counted during the time the analytics runs
- Click the Edit Analytics button to make changes to the current analytics settings
- Click the View All Analytics Events button to see all events from the selected analytics
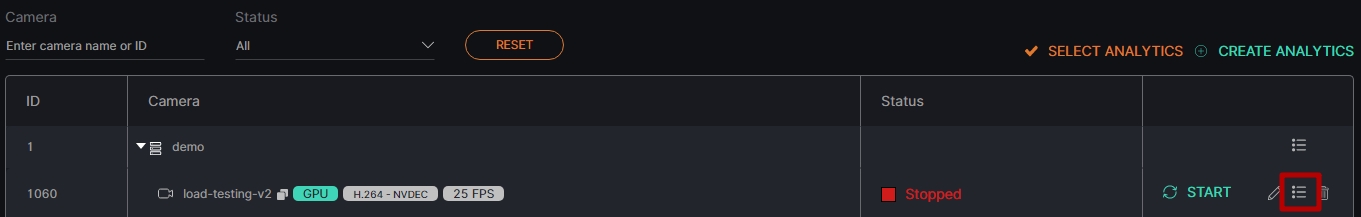
View Events
To view selected analytics events in the Analytics item, click the Events icon on the toolbox:
Delete Analytics
To delete the analytics:
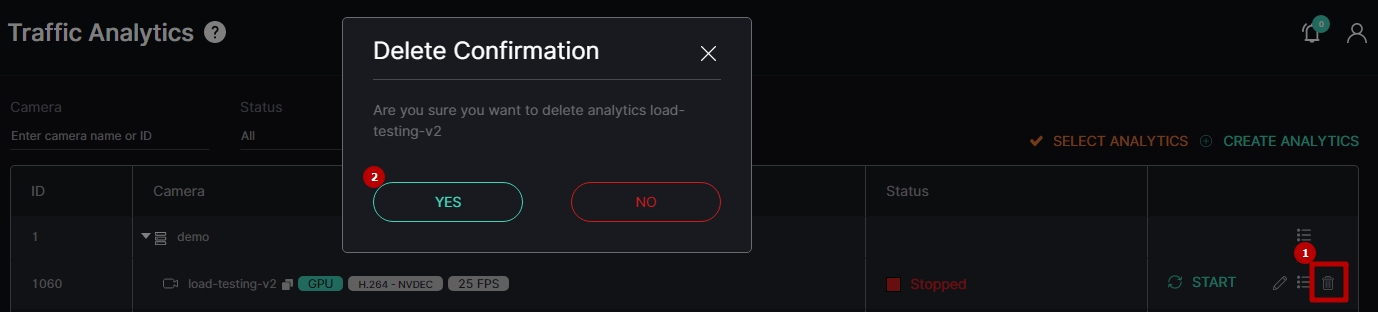
- Select the Delete icon on the toolbox
- Confirm the intention