Traffic Analytics: Statistics
This page describes the Statistics item that allows viewing statistics from the selected video stream.
Overview
To open the Statistics item, in the left menu:
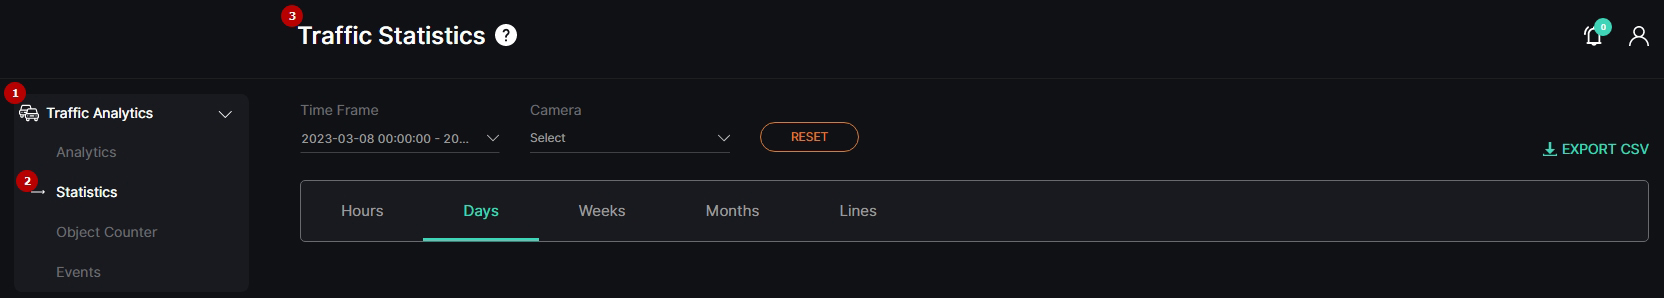
- Select the Traffic Analytics section
- Choose the Statistics item
- See statistics
Use and Functionality
The Traffic Statistics functional menu comprises:
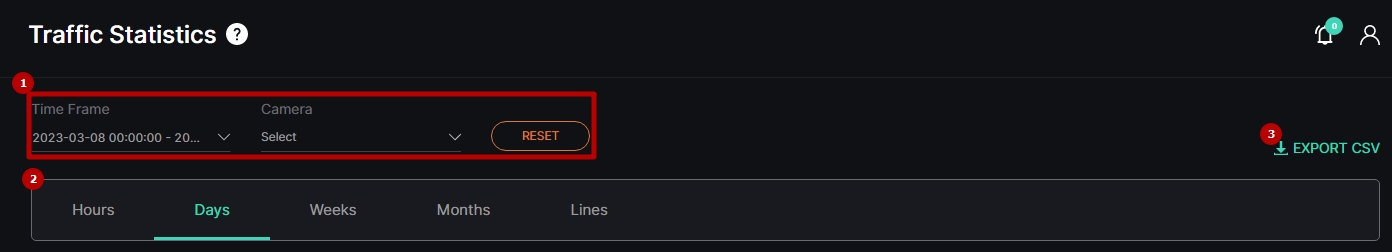
- Filters to:
- Select the desired time frame to produce statistics
- Click the Camera parameter to select the desired video analytics. In the pop-up window:
- Check the boxes next to the required video analytics and folders
- Click the Select Video Analytics button
- Click the Reset button to clear the filters
- Tabs to filter statistics data by:
- Hours
- Days
- Weeks
- Months
- Lines
- Export option to download the statistics report in the CSV format
The Statistics item opens with the Days tab by default.
Hours Tab
The Hours tab shows:
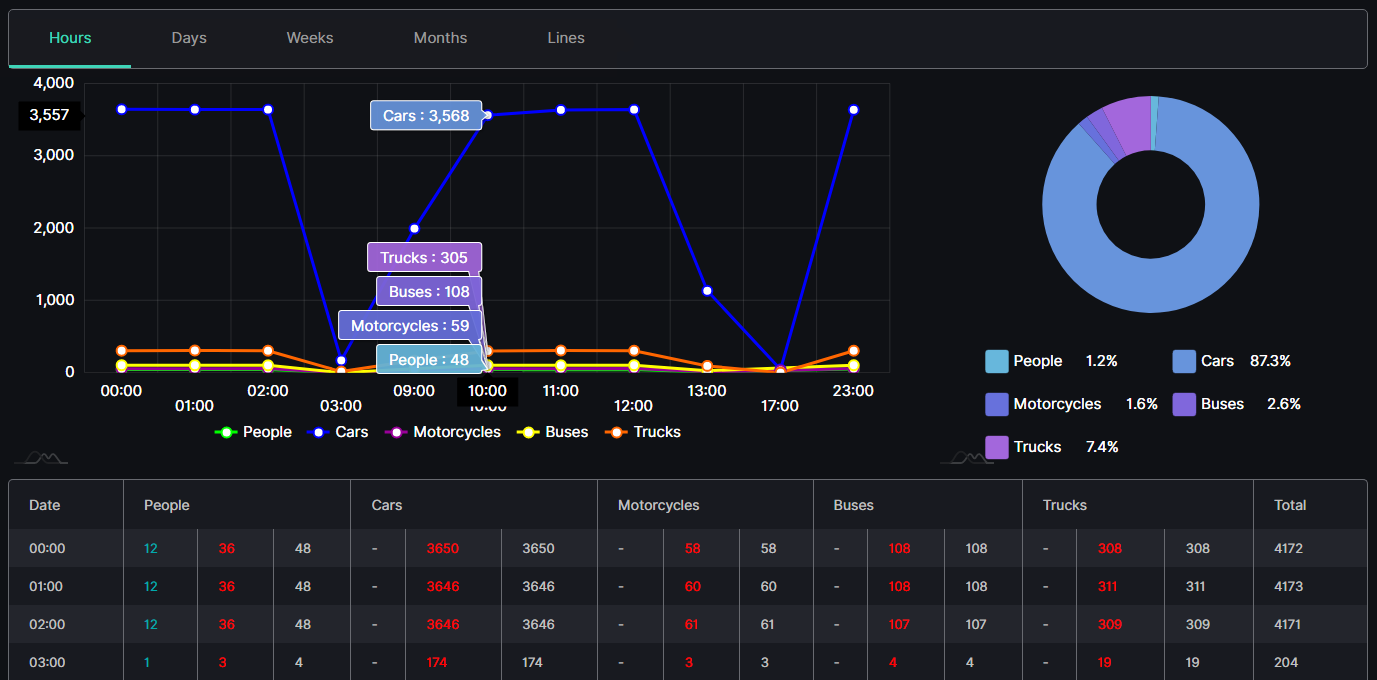
- Checkpoints on the graphs by object quantity and hours
- Slices on the donut chart with the amount of the recognized objects in percentage
- Table columns by hours and object types
- The object quantity and amount can be seen by hovering the mouse over the graphs.
- The time indicator in the Hours statistics displays the hour for which the statistics were collected. For example, a time entry of 13:00 indicates that the statistics were collected during the 13:00-13:59 time period.
Each object type column is divided into 3 subcolumns by direction:
- Green for entry direction
- Red for exit direction
- Grey for the sum of both directions
Days, Weeks, and Months Tabs
The Days tab shows:
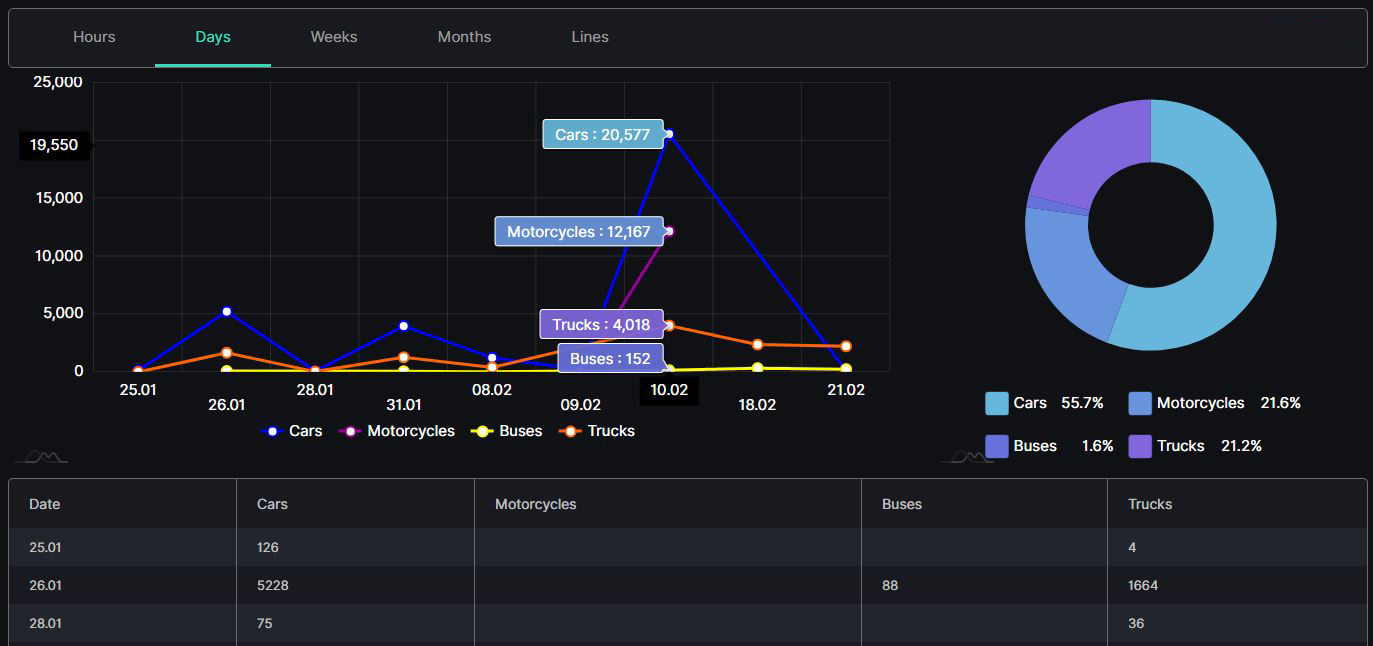
- Checkpoints on the graphs by object quantity and date
- Slices on the donut chart with the amount of the recognized objects in percentage
- Table columns by date and object types
- Hover the mouse over the graphs to see the object quantity and amount.
- The Weeks and Months tabs' content differs with the usage of week and month time intervals instead of days.
Lines Tab
The Lines tab shows the tables per selected dates that comprise:
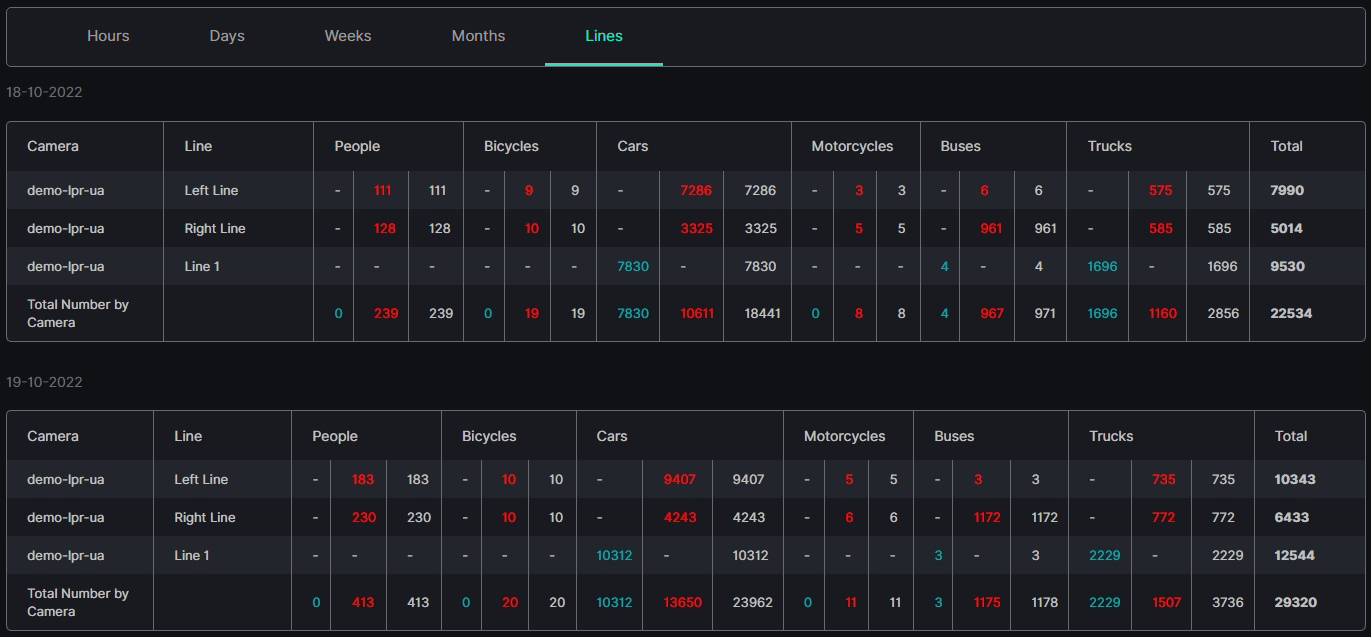
- Camera column with the video stream name(s)
- Line column with the line (rule) name(s)
- Object type columns with the preselected objects
Each object type column is divided into 3 subcolumns by direction:
- Green for entry direction
- Red for exit direction
- Grey for the sum of both directions