Speed Control: Report
This page describes the Report tab that allows viewing average speed statistics from the selected rule.
Overview
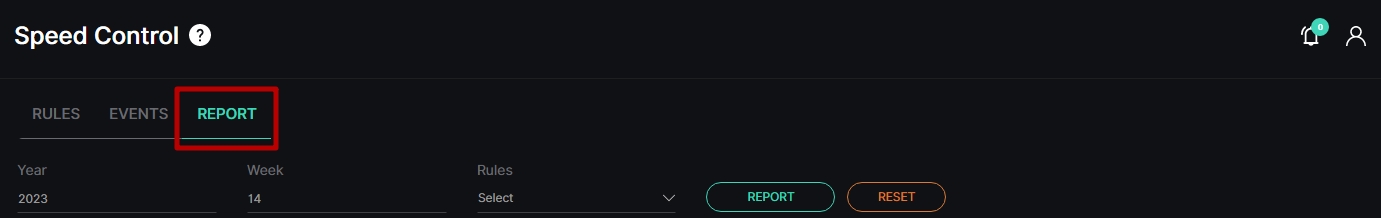
Select the Report tab in the tabs menu:
Use and Functionality
The Report tab functional menu comprises:
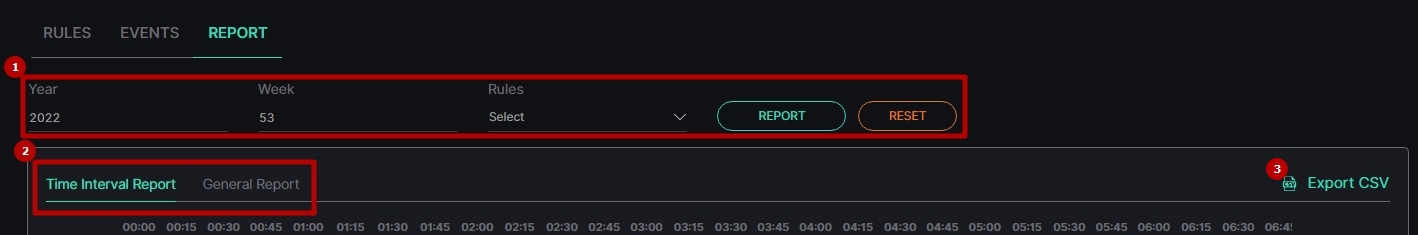
- Filters to:
- Enter the required year and week
- Select multiple rules from the drop-down list
- Click the Report button to start filtering
- Click the Reset button to clear the filters
- Tabs to display statistics in:
- Time Interval Report
- General Report
- Export option to download the speed report in the CSV format
- The Time Frame filter is enabled only for the General Report tab.
- The Export option is available only for the Time Interval Report tab.
Time Interval Report Tab
The Time Interval Report shows:
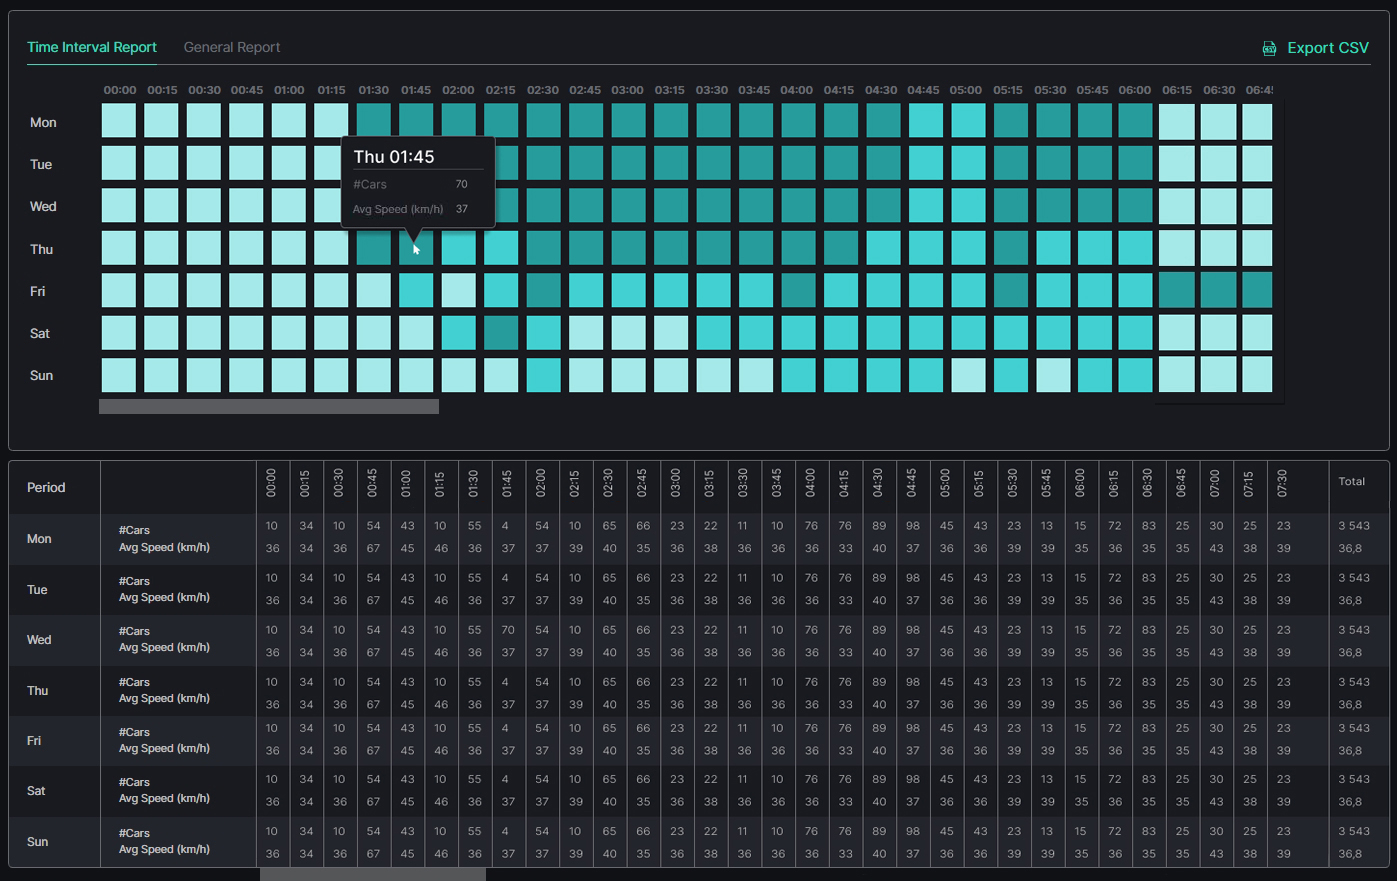
- Table chart with the number of vehicles and average speed by 15 minutes time intervals and days of a week
- Table with columns by 15 minutes time intervals and rows by days of the week, number of vehicles, and average speed
General Report Tab
The General Report allows to:
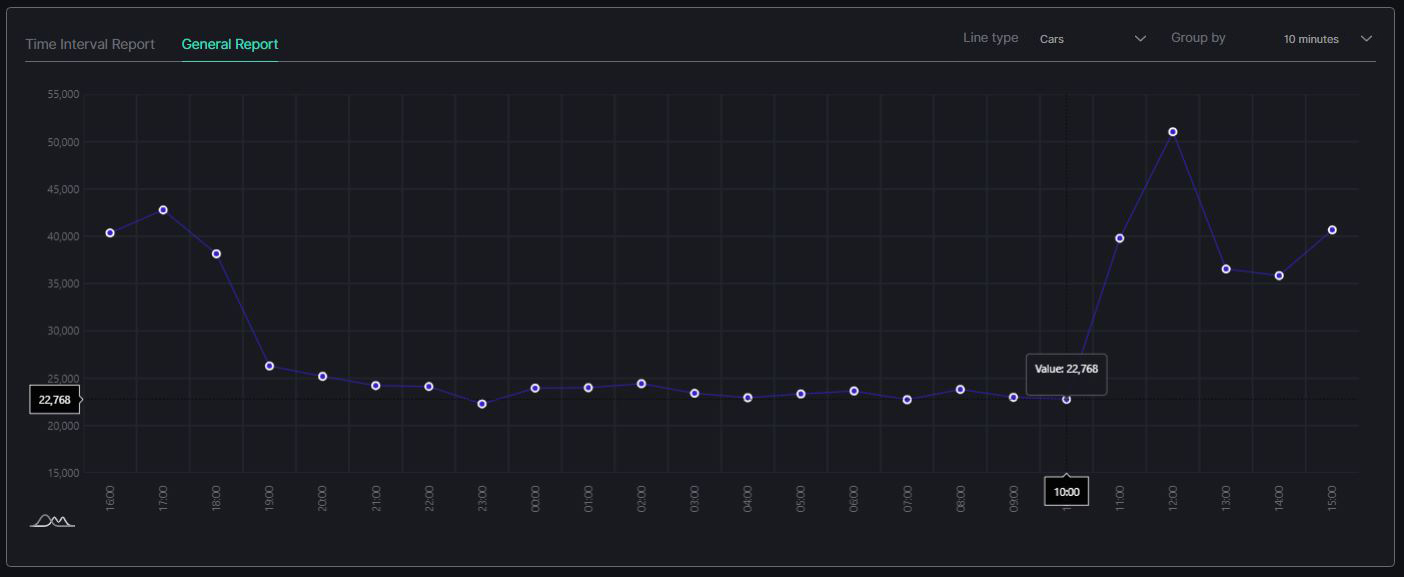
- Select the Line Type parameter from a drop-down list that the curve displays on the graph:
- Average speed (km/h)
- Average speed (mi/h)
- Cars quantity
- Select the desired time intervals from a Group By drop-down list to set the intervals between the graph breakpoints
- Hover the mouse over the desired breakpoint on the graph to view the specific statistics data