Servers
This page describes the Servers item that allows viewing the data of server load and analytics activity.
Overview
To open the Servers item, in the left menu:
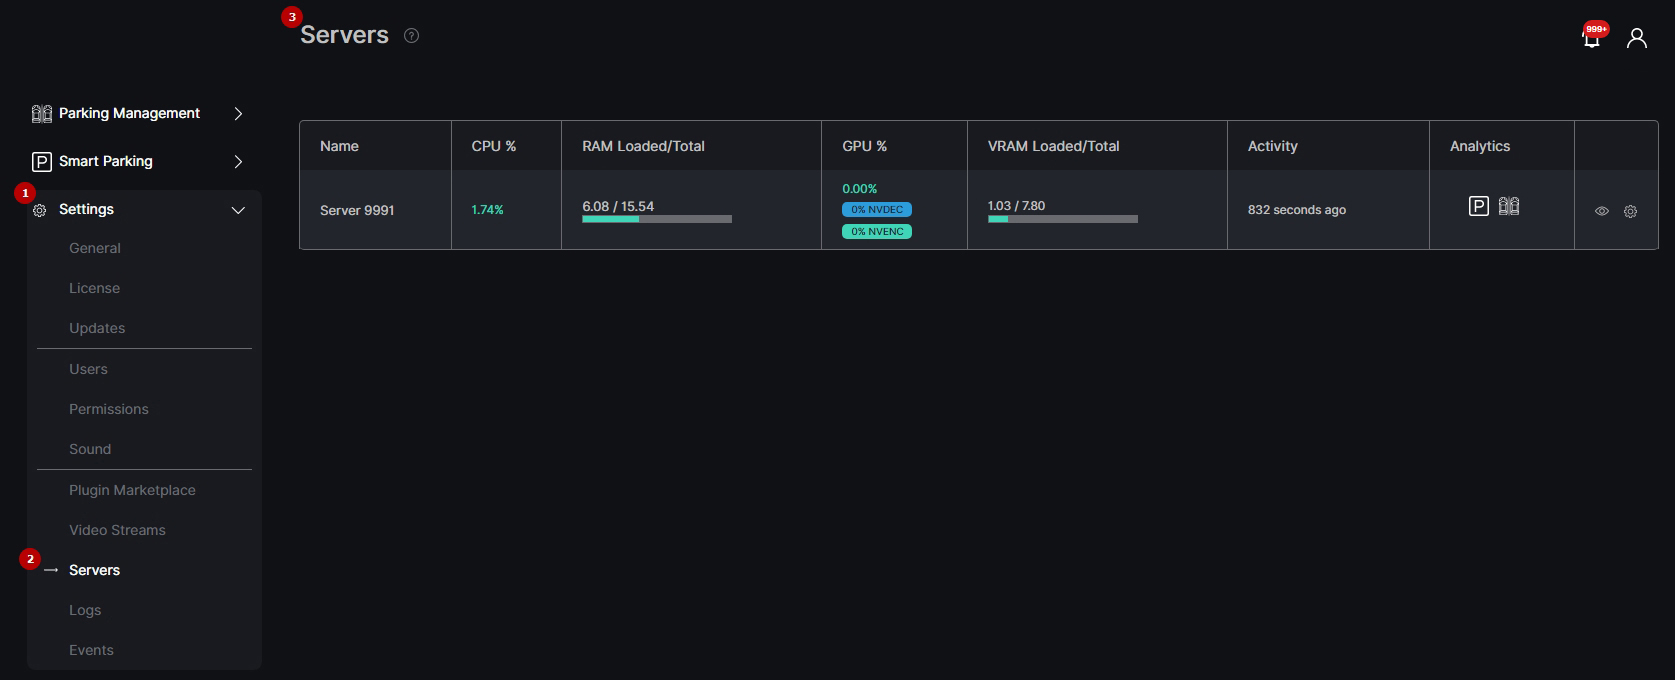
- Select the Settings section
- Choose the Servers item
- See servers
Use and Functionality
The Servers item shows:
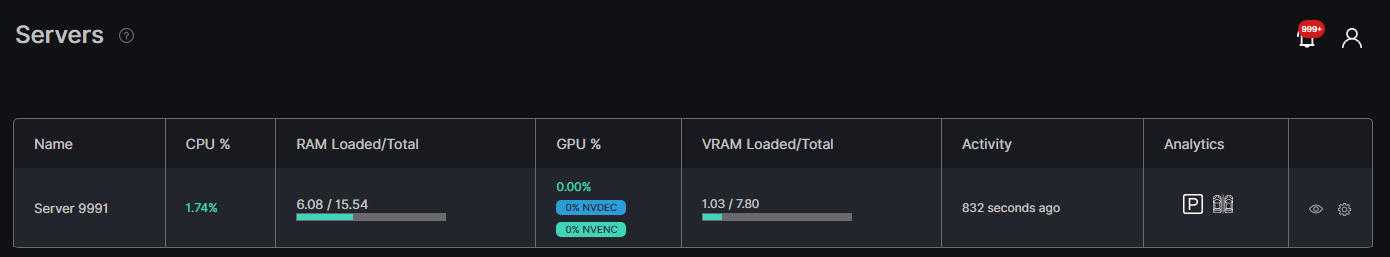
- Server name
- CPU and GPU current activity in percentage
- RAM and VRAM load
- Latest update time of the server load data
- Current working analytics
The GPU % column also displays the current percent of GPU consumption by the encoding and decoding processes.
Server Details
To view server details:
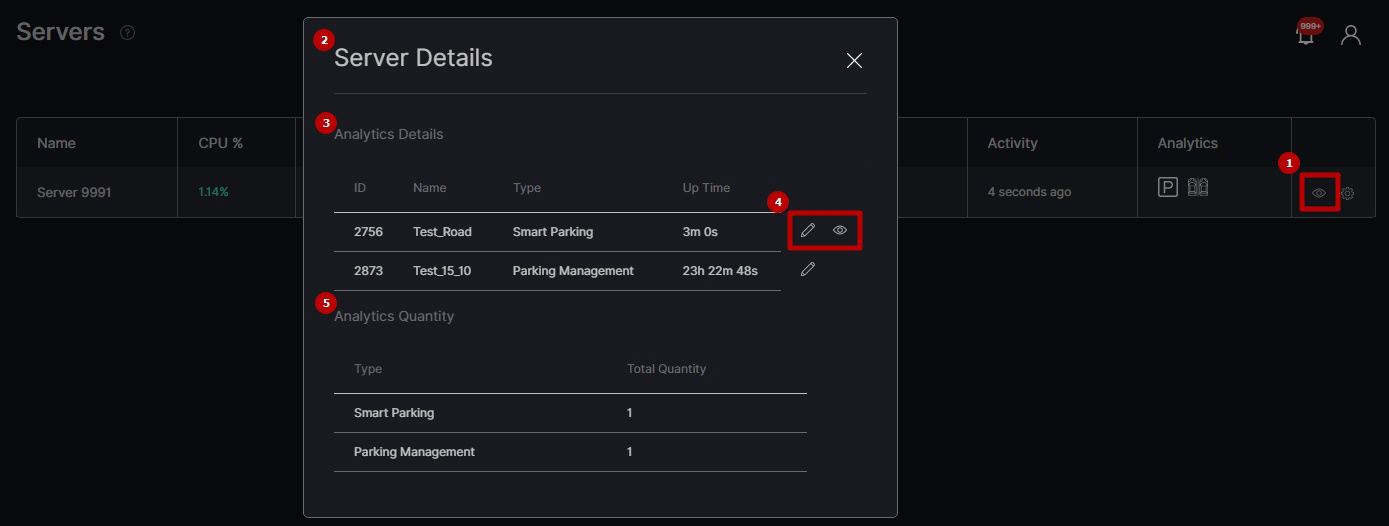
- Click the View icon on the toolbox
- See the Server Details pop-up window
- View active analytics details
- Click the:
- Edit icon to edit settings in the selected analytics
- View icon to see the selected analytics process in real-time
- View active analytics quantity
Edit Server
To edit server parameters:

- Click the Settings icon on the toolbox
- Fill in the fields in the Edit Server pop-up window:
- Edit the server's name
- Select NIC to receive real-time analytics broadcast
- Specify the IP address of the analytic server responsible for broadcasting real-time analytics
- Specify the port for real-time analytics broadcast or leave the default setting (3020)
- Click the Save button to apply changes
If you changed the Port, after saving the settings it is necessary to restart the analytical services:
- For Windows:
- Press the Win + X keys and select the Computer Management option in the context menu
- Navigate to the Services and Applications tab
- Select the Services option
- Select Incoresoft ProcessRunner Service from the list and click the Restart button to restart the service
- For Linux: sudo systemctl restart incoresoft-process-runner.service