Lists: Report
This page describes the Report tab that allows viewing statistics for vehicles from the lists.
Overview
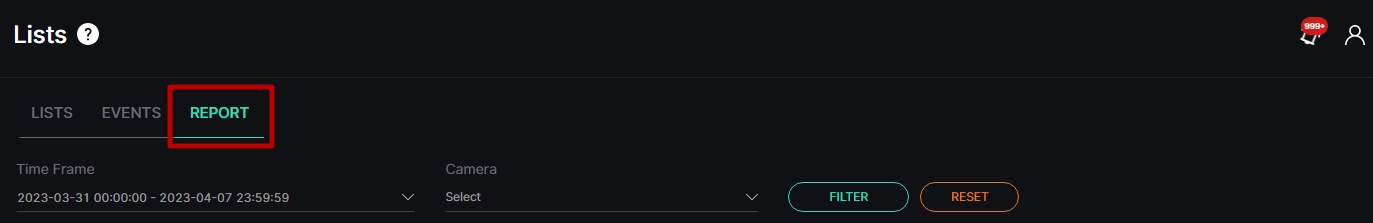
Select the Report tab in the tabs menu:
Use and Functionality
The Report tab functional menu comprises:
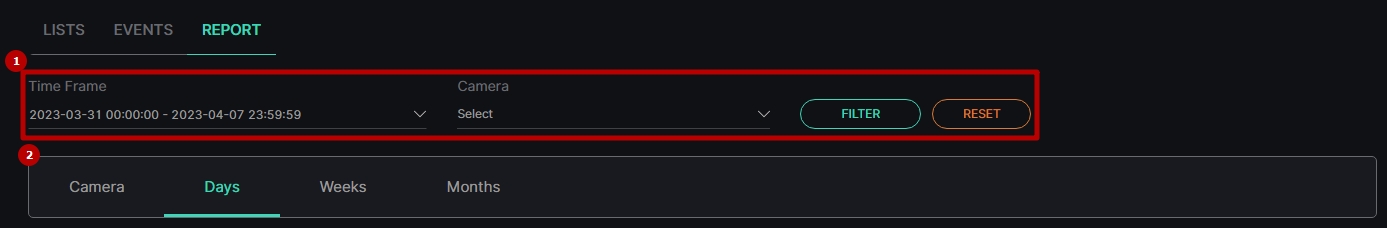
- Filters to:
- Select the desired time frame to produce statistics
- Click the Camera parameter to choose the desired video analytics. In the pop-up window:
- Check the boxes next to the required video analytics and folders
- Click the Select Video Analytics button
- Click the Filter button to start filtering
- Tabs to filter statistics data by:
- Camera
- Days
- Weeks
- Months
The Report tab opens with the Days tab by default.
Camera Tab
The Camera tab shows:
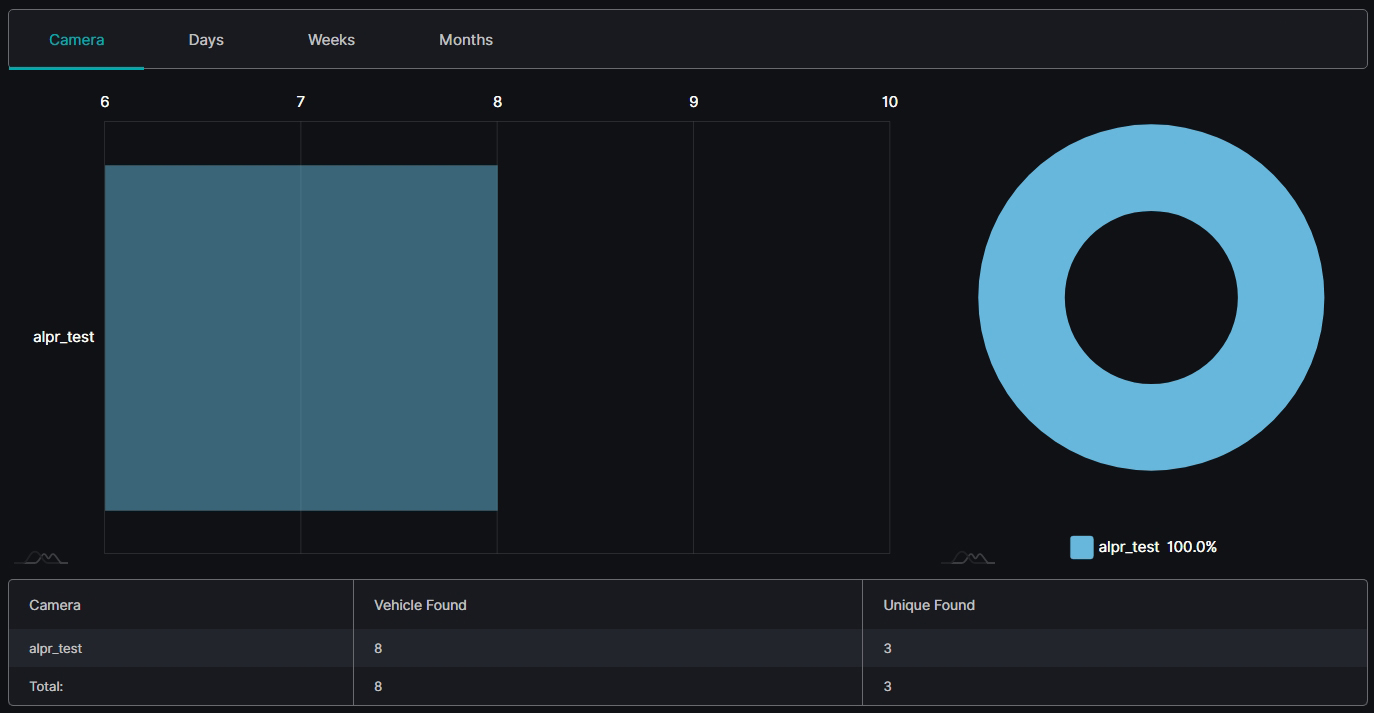
- Rectangular bars on the bar chart with lengths proportional to the vehicles from lists quantity detected by selected cameras
- Slices on the donut chart with the amount of the found by selected cameras vehicles from lists in percentage
- Table columns by selected cameras, detected vehicles from lists, and unique vehicles (detected by the desired camera or by all cameras in general)
- Vehicle Found column counts every time the vehicle from the lists was detected by the camera.
- Unique Found column counts only detected unique vehicle numbers from the lists. The unique vehicle number is counted only once for the selected time frame.
Days Tab
The Days tab shows:
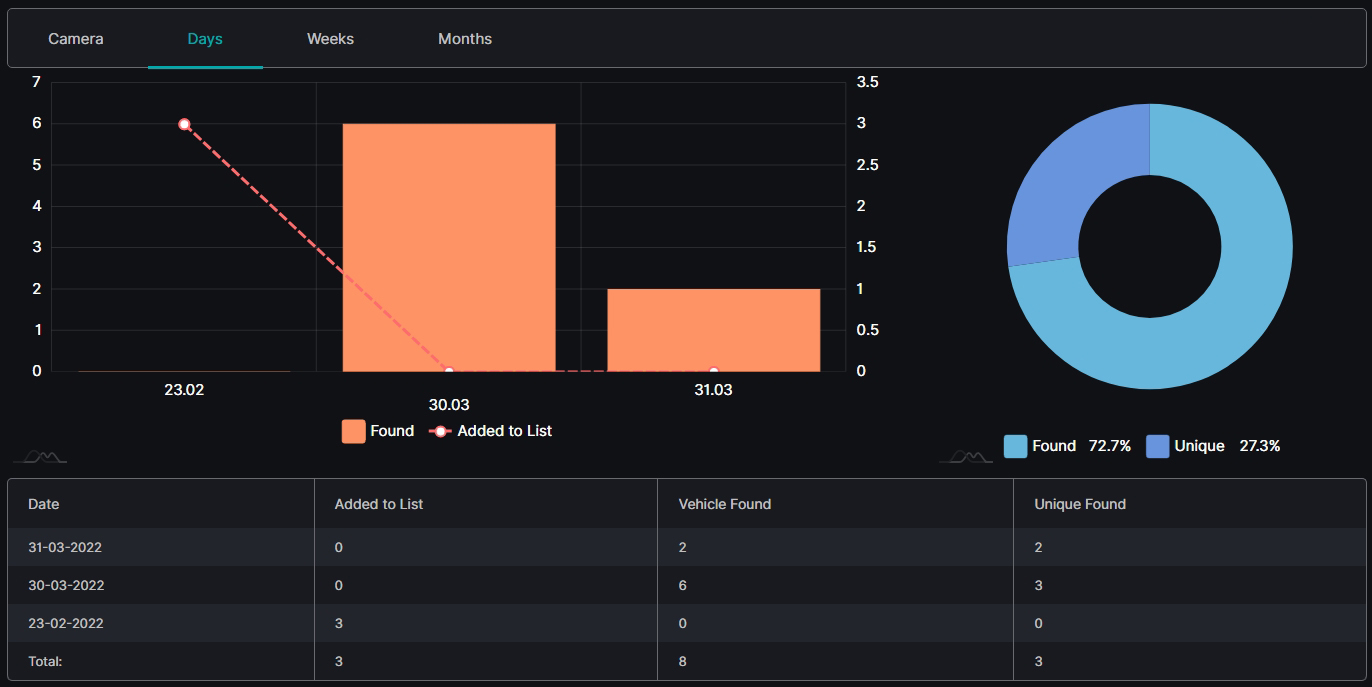
- Columns on the combo chart with heights proportional to the number of vehicles from the lists (scale with numbers to the left of the graph) detected within the required date
- Checkpoints on the combo chart by vehicles quantity (scale with numbers to the right of the graph) added to the list within the required date
- Slices on the donut chart with the amount of the total found and unique vehicles from lists in percentage
- Table columns by date, number of vehicles added to the lists, detected vehicles from lists, and unique vehicles (detected by the desired camera or by all cameras in general)
Weeks and Months Tab
The Weeks tab shows:
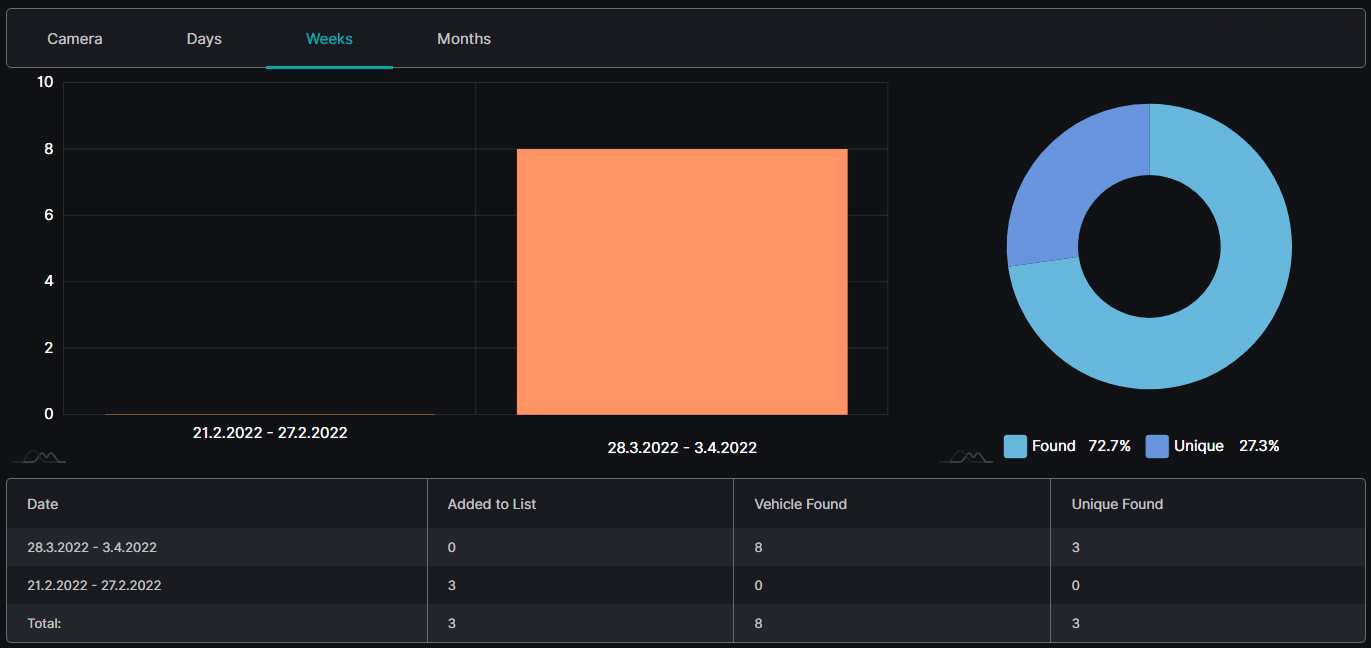
- Columns on the column chart with heights proportional to the number of vehicles from the lists detected within the required weeks
- Slices on the donut chart with the amount of the total found and unique vehicles from lists in percentage
- Table columns by weeks, number of vehicles added to the lists, detected vehicles from lists, and unique vehicles (detected by the desired camera or by all cameras in general)
- Hover the mouse over the graphs to see the object quantity and amount.
- The Months tab content differs with the usage of month time intervals instead of weeks.