Face Recognition: Statistics
Introduction
Unique faces are considered as separate individuals detected by the analytics each day, regardless of the number of times they appear in the camera's field of view. For example, when one customer enters the shop five times during a day, they will be counted as one unique face in the statistics.
Within a selected time period longer than a day, such as a week or a month, the statistics summarize the number of unique faces detected for each day. This information is valuable in calculating the average quantity of unique faces per day over the specified time span.
Due to the resource-intensive nature of processing unique face data, the statistics are generated only at midnight for the previous day. As a result, no data for the current day will be displayed in the statistics until the following day.
Overview
To open the Statistics item, in the left menu:
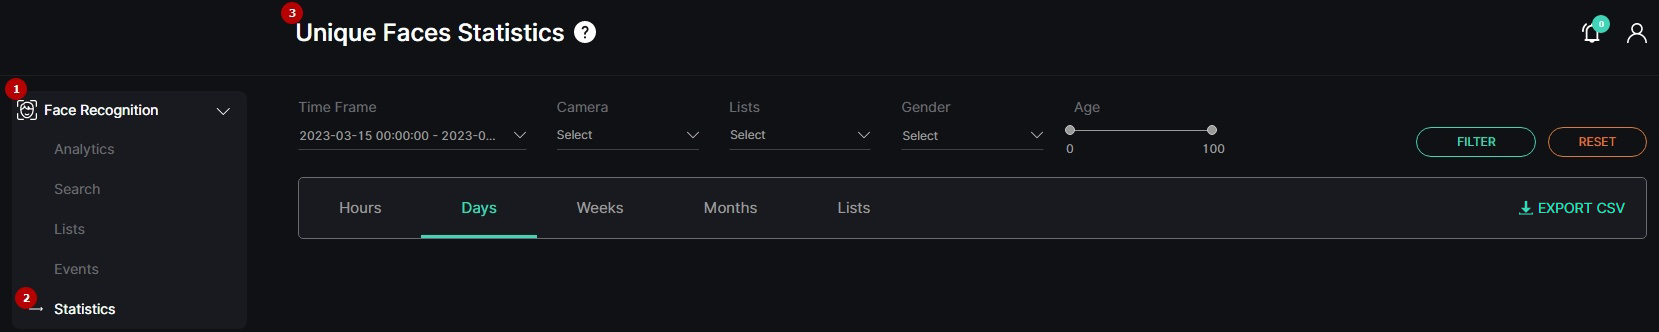
- Select the Face Recognition section
- Choose the Statistics item
- See unique faces statistics
Use and Functionality
The Unique Faces Statistics functional menu comprises:
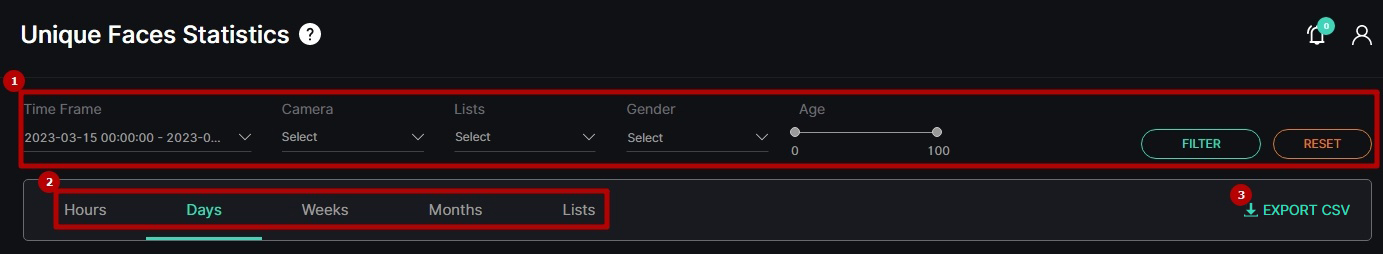
- Filters to:
- Select the desired time frame to produce statistics
- Click the Camera parameter to select the desired video analytics. In the pop-up window:
- Check the boxes next to the required video analytics and folders
- Click the Select Video Analytics button
- Select multiple lists
- Choose the gender from the drop-down list
- Set the age range by moving the sliders
- Click the Filter button to start filtering
- Click the Reset button to clear the filters
- Tabs to filter statistics data by:
- Hours
- Days
- Weeks
- Months
- Lists
- Export CSV option to download the statistics report in the CSV format
- The Unique Faces Statistics item opens with the Days tab by default.
- The Export CSV option is available only for the Days and Lists tabs.
- To filter unique faces that have not been added to any list, select Off the List in the Lists filter.
Hours Tab
The Hours tab shows:
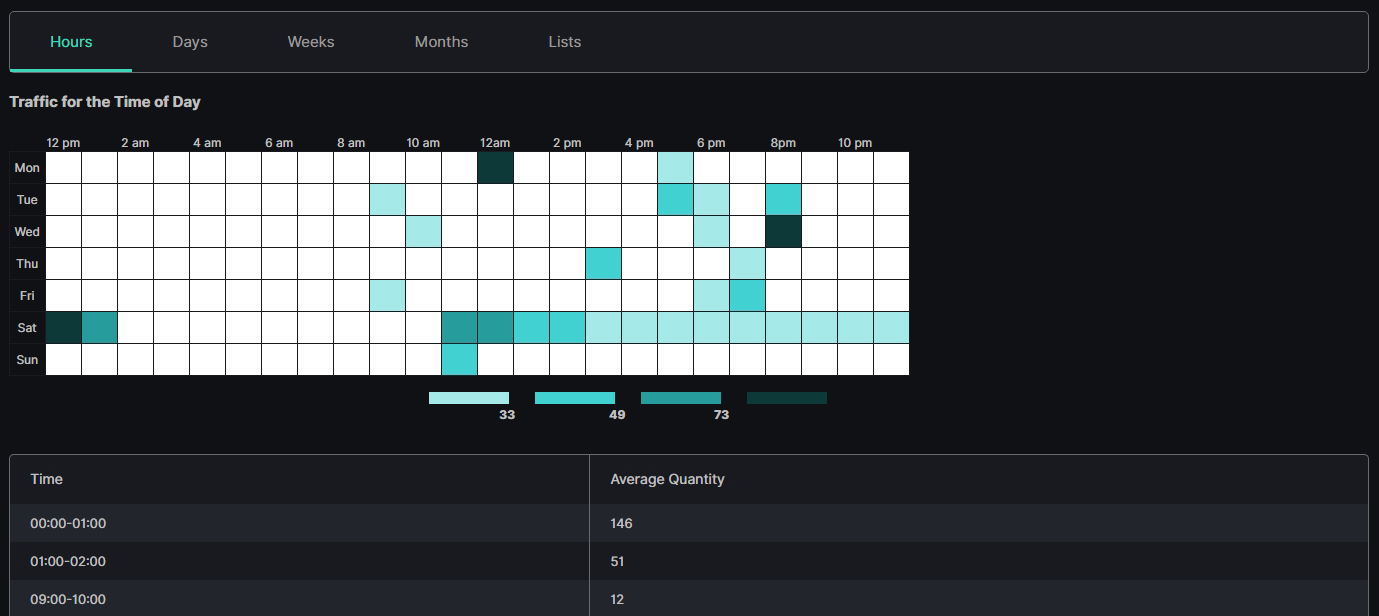
- Table chart with the unique faces data by hours and days of a week
- Table with Time and Average Quantity columns
Days, Weeks, and Months Tabs
The Days tab shows:
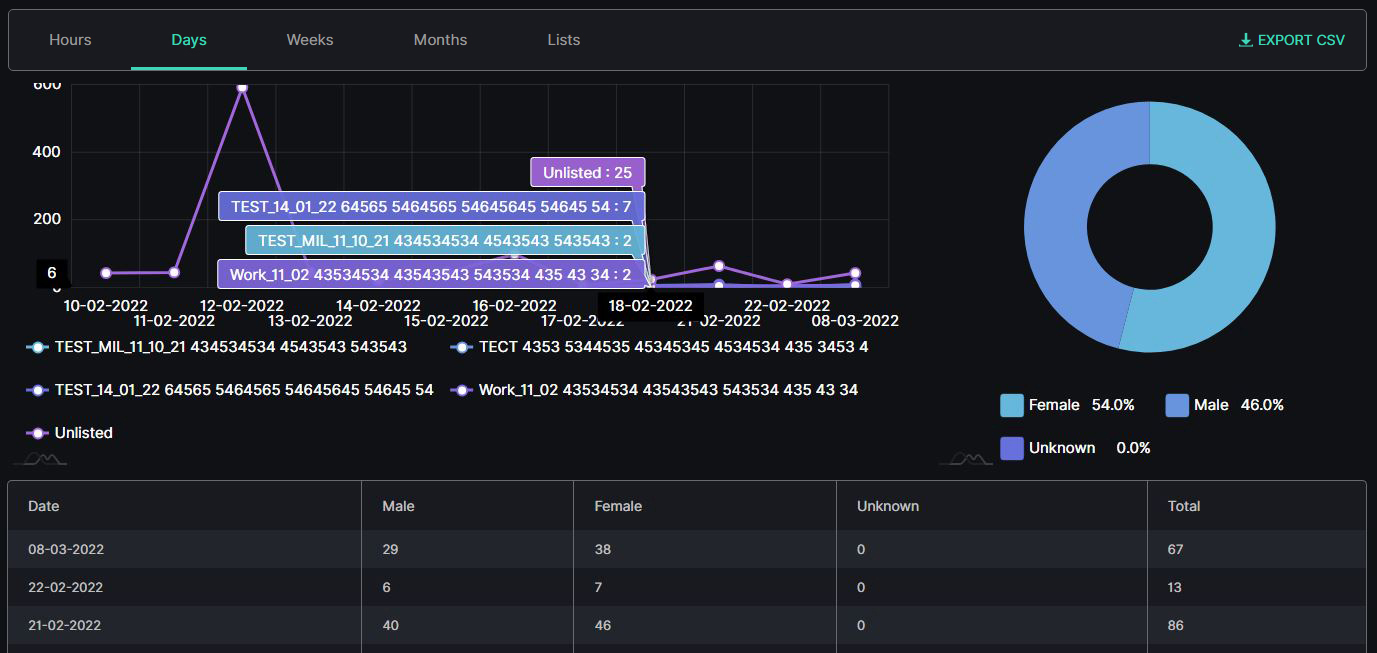
- Checkpoints on the graphs by listed and unlisted unique faces quantity and date
- Slices on the donut chart with the amount of the unique faces recognized by gender in percentage
- Table columns by date and gender
- Hover the mouse over the graphs to see the unique faces quantity and amount.
- The Weeks and Months tabs' content differs with the usage of week and month time intervals instead of days.
Lists Tab
The Lists tab shows the tables per selected dates that comprise:
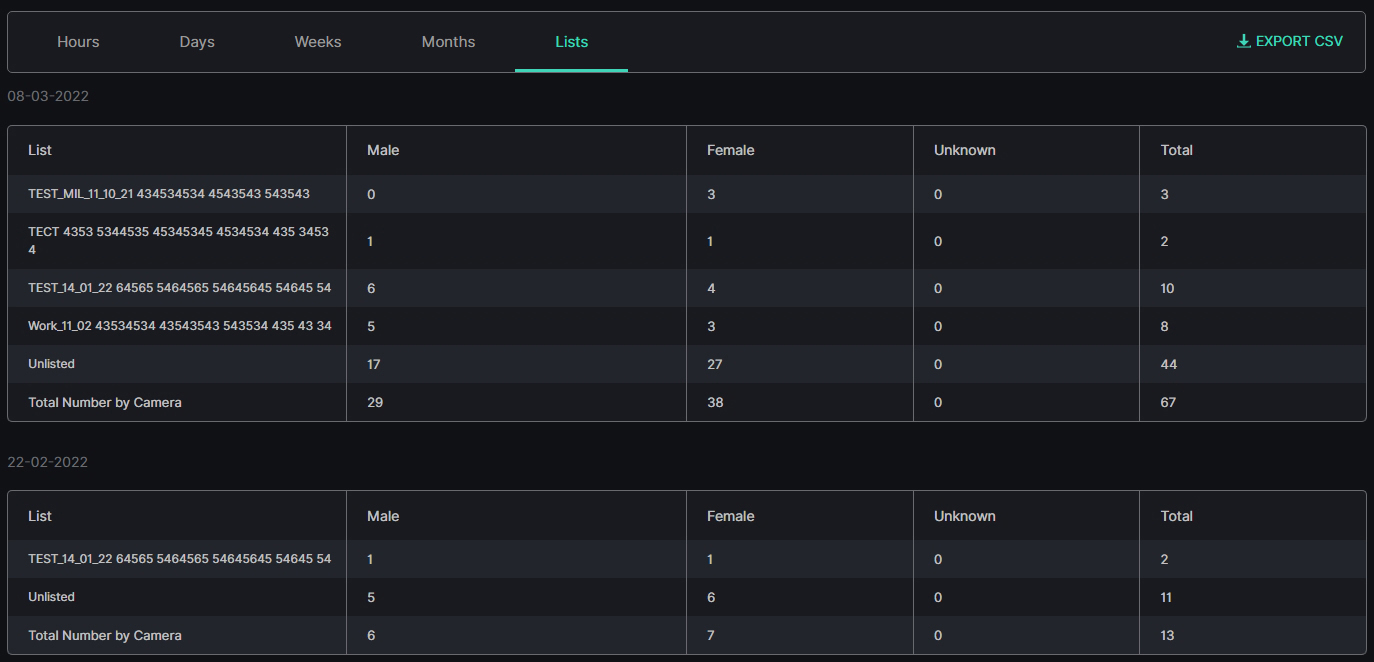
- List column with the preselected list name(s)
- Gender columns with the preselected gender