Heat Map: Camera Statistics
This page describes the Сamera Statistics item that allows viewing heat maps filtered by cameras for a selected period of time.
Overview
To open the Camera Statistics item, in the left menu:
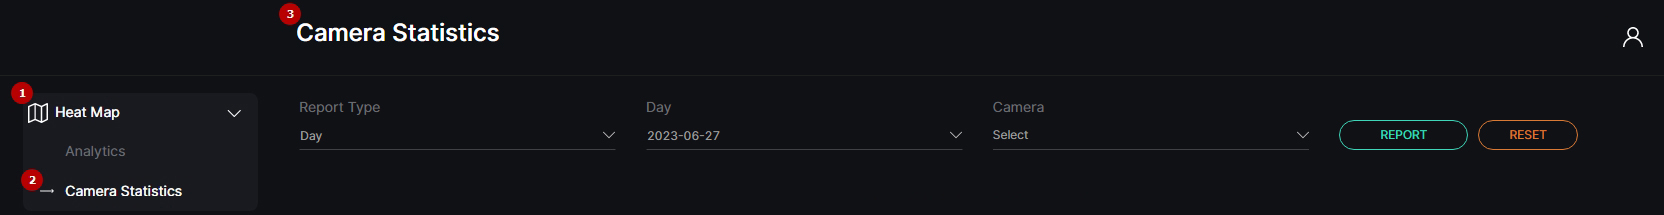
- Select the Heat Map section
- Choose the Camera Statistics item
- See camera statistics functional menu
Use and Functionality
The Camera Statistics functional menu allows to:
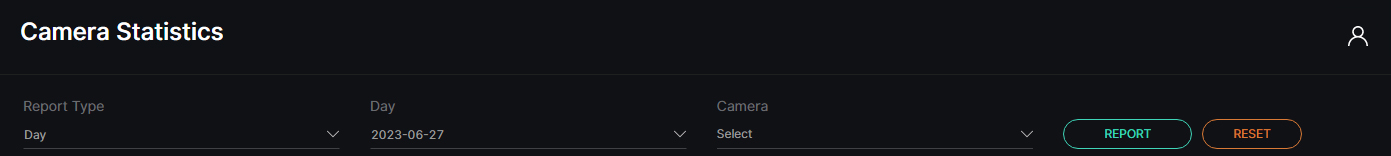
- Select the desired report type by the period of time:
- Day
- Week
- Month
- Set the date in the Day field
- Click the Camera parameter to select the desired video analytics. In the pop-up window:
- Check the boxes next to the required video analytics and folders
- Click the Select Video Analytics button
- Click the Report button to start filtering
- Click the Reset button to clear the filters
Once selected and filtered, in the generated heat map statistics:
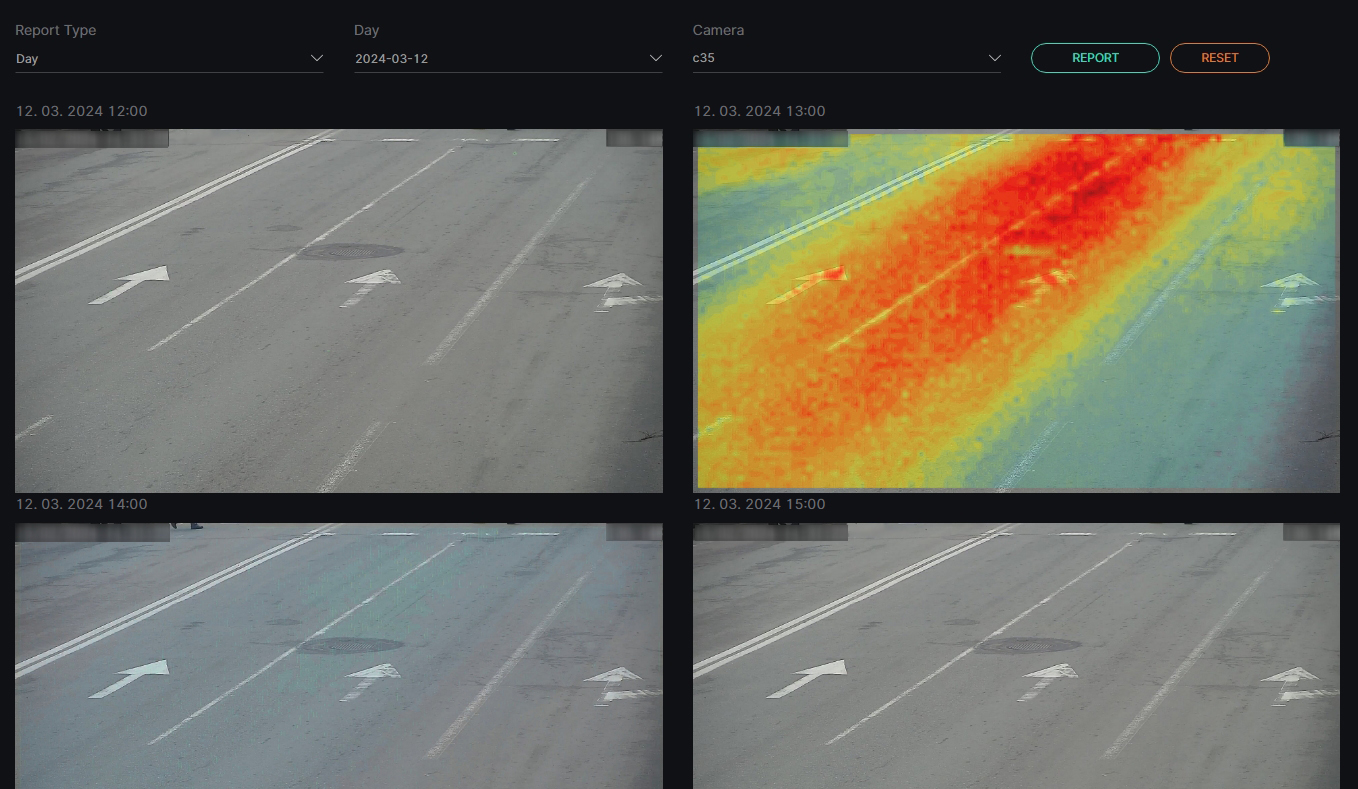
- View the frames featuring generated heat maps for each date and time period
- Click on a frame with a heat map to view and save it in full-size
- Click the green Date Range Refiner icon next to any desired frame:
- If the Month report type is selected, refine it to the week containing the selected date
- If the Week report type is selected, refine it further to the hourly statistics of the selected day
- If the Day report type is selected, the green Date Range Refiner icon is not available as hourly statistics cannot be refined any further
- For the Day report type, the statistics display hourly heat map data for the selected day.
- For the Week report type, the statistics show data for each day of the calendar week that includes the selected day.
- For the Month report type, the statistics show data for each day of the calendar month that includes the selected day.
- The time indicator in the Day statistics displays the hour for which the statistics were collected. For example, a time entry of 13:00 indicates that the statistics were collected during the 13:00-13:59 time period.
- The time indicator in the Week or Month statistics indicates that the data was collected throughout the day from 00:00 to 23:59 for each day.
- When refining the date range using the Date Range Refiner icon, the parameters in the filters also change according to the refinement type.