Age & Gender Detection: Statistics
This page describes the Statistics item that allows viewing statistics from the selected video stream.
Overview
To open the Statistics item, in the left menu:
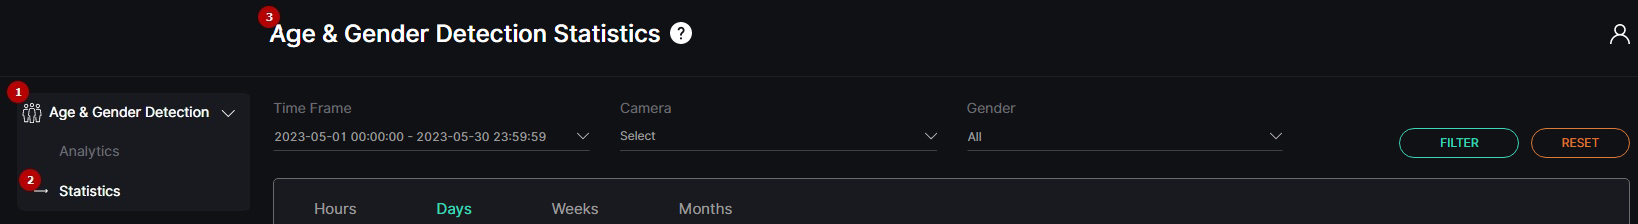
- Select the Age & Gender Detection section
- Choose the Statistics item
- See statistics
Use and Functionality
The Age & Gender Detection Statistics functional menu comprises:
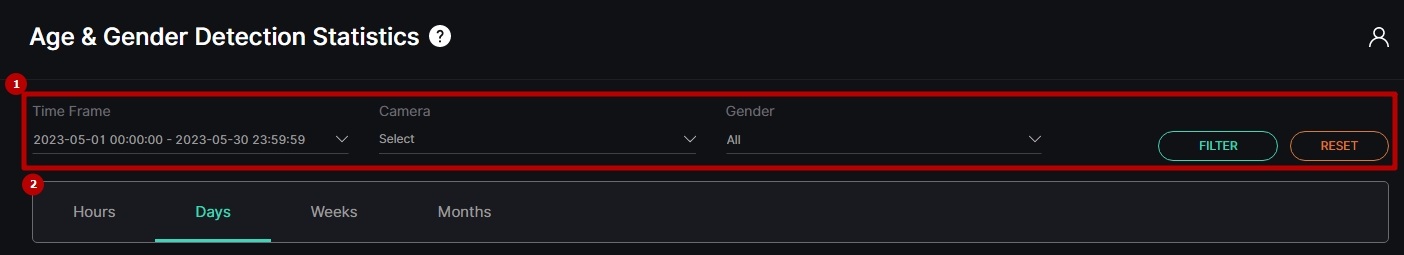
- Filters to:
- Select the desired time frame to produce statistics
- Select multiple video streams in the Camera drop-down list
- Choose the gender from the drop-down list
- Click the Filter button to start filtering
- Click the Reset button to clear all filters
- Tabs to filter statistics data by:
- Hours
- Days
- Weeks
- Months
The Statistics item opens with the Days tab by default.
Hours Tab
The Hours tab shows:
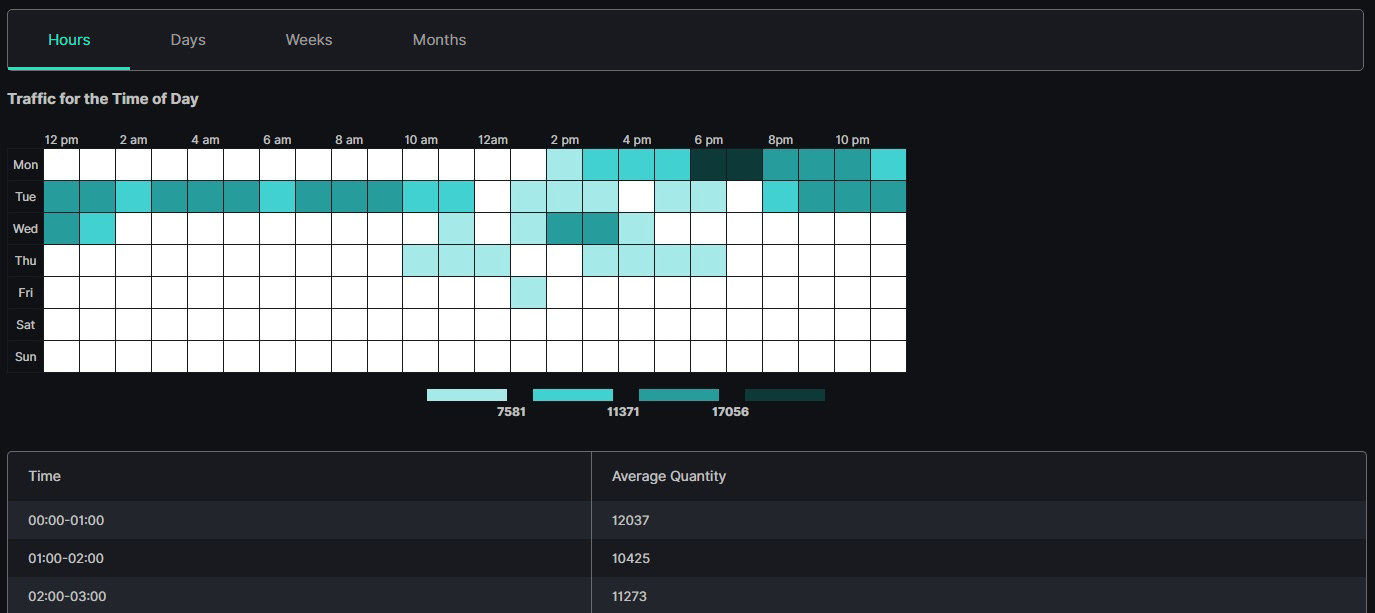
- Table chart with the people data by hours and days of a week
- Table with Time and Average Quantity columns
Days, Weeks, and Months Tabs
The Days tab shows:
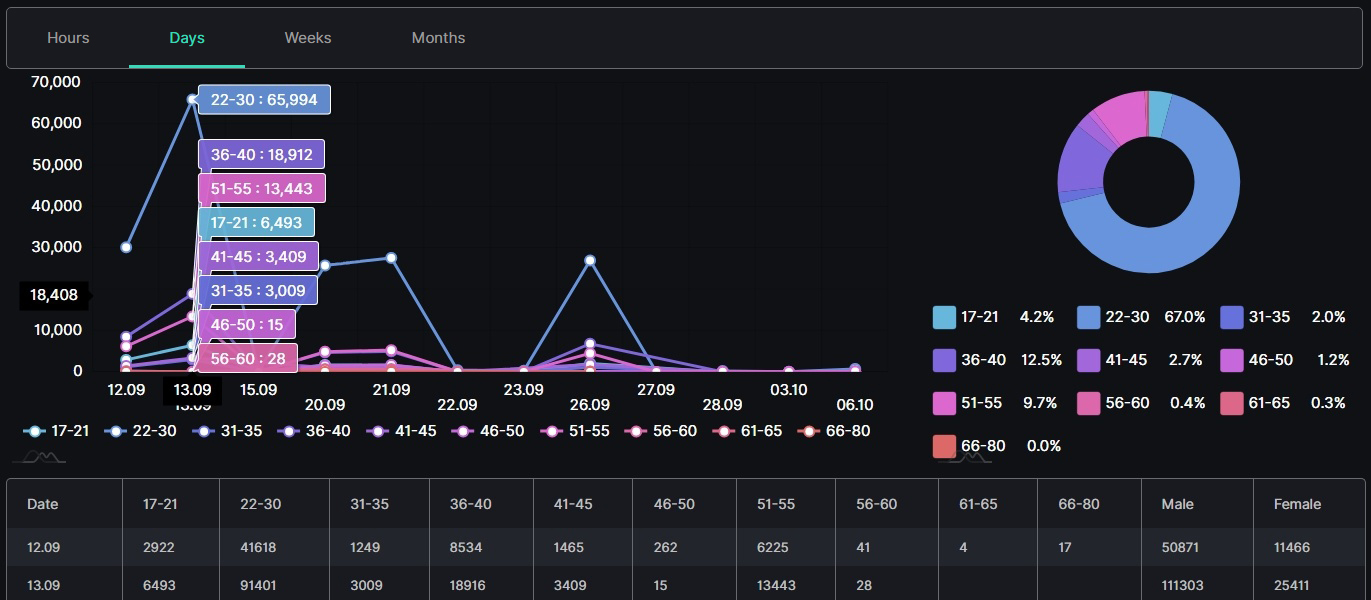
- Checkpoints on the graphs by date and people quantity divided by age
- Slices on the donut chart with the amount of the recognized people in percentage for each age group
- Table columns by date, age group, and gender
- Hover the mouse over the graphs to see the people quantity and amount.
- The Weeks and Months tabs' content differs with the usage of week and month time intervals instead of days.