LPR: Vehicle Statistics
This page describes the Vehicle Statistics item that allows viewing statistics from the selected video stream.
Overview
To open the Vehicle Statistics item, in the left menu:
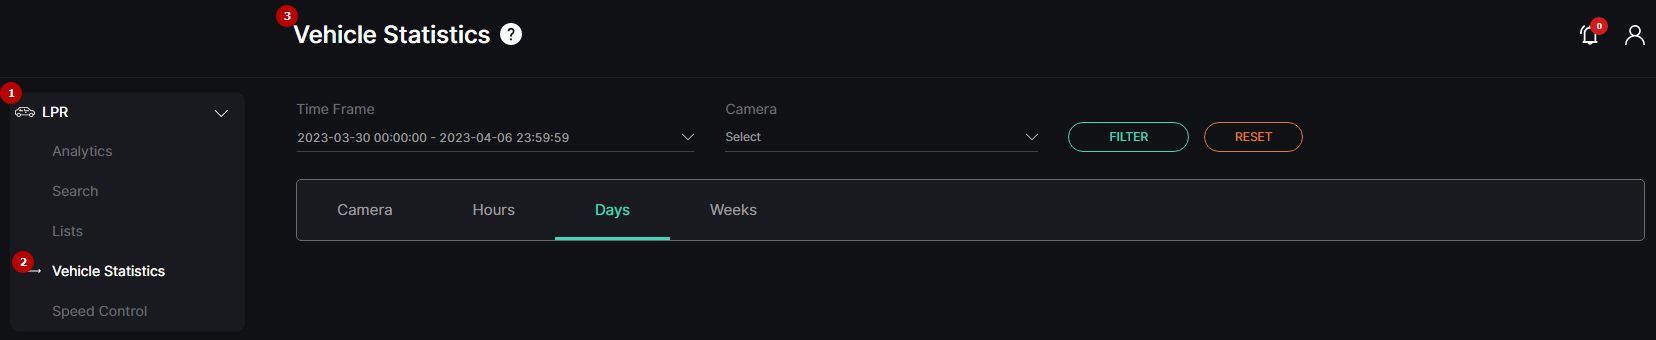
- Select LPR section
- Choose Vehicle Statistics item
- See statistics
Use and Functionality
The Vehicle Statistics functional menu comprises:
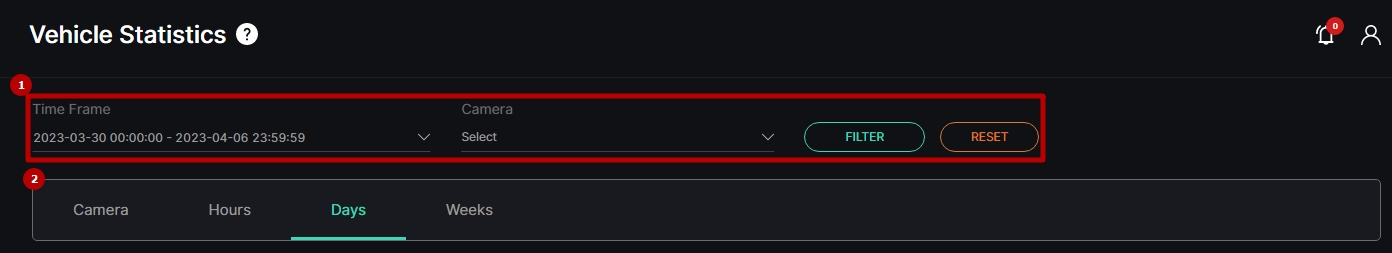
- Filters to:
- Select the desired time frame to produce statistics
- Click the Camera parameter to choose the desired video analytics. In the pop-up window:
- Check the boxes next to the required video analytics and folders
- Click the Select Video Analytics button
- Click the Filter button to start filtering
- Tabs to filter statistics data by:
- Camera
- Hours
- Days
- Weeks
The Vehicle Statistics item opens with the Days tab by default.
Camera Tab
The Camera tab shows:
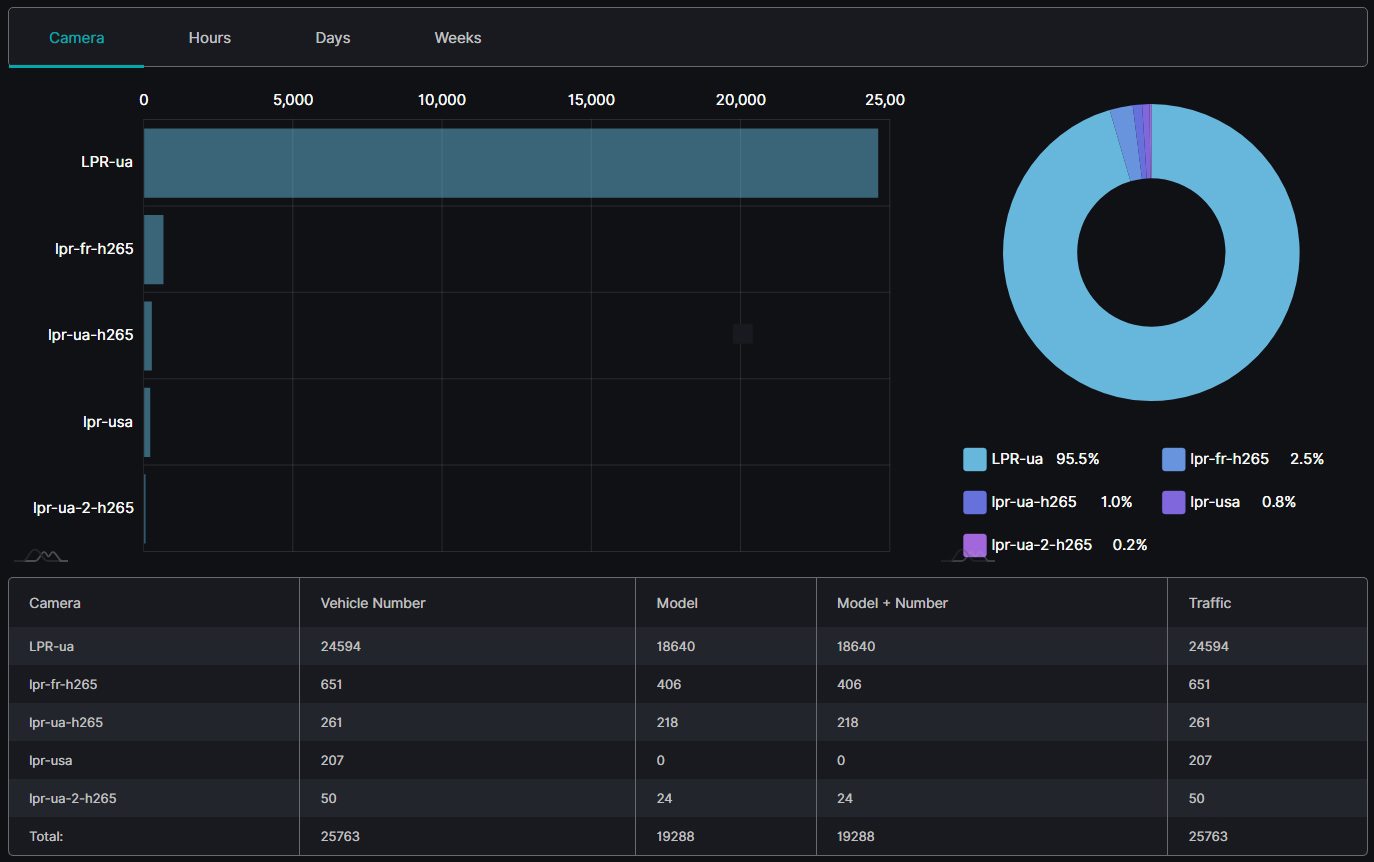
- Rectangular bars on the bar chart with lengths proportional to the vehicle quantity detected by selected cameras
- Slices on the donut chart with the amount of the found by selected cameras vehicles in percentage
- Table columns by selected cameras, detected vehicle number and model, as well as their total number detected by the desired camera or by all cameras in general
Hover the mouse over the donut chart's slices to see the found vehicle quantity and amount by a required camera.
Hours Tab
The Hours tab shows:
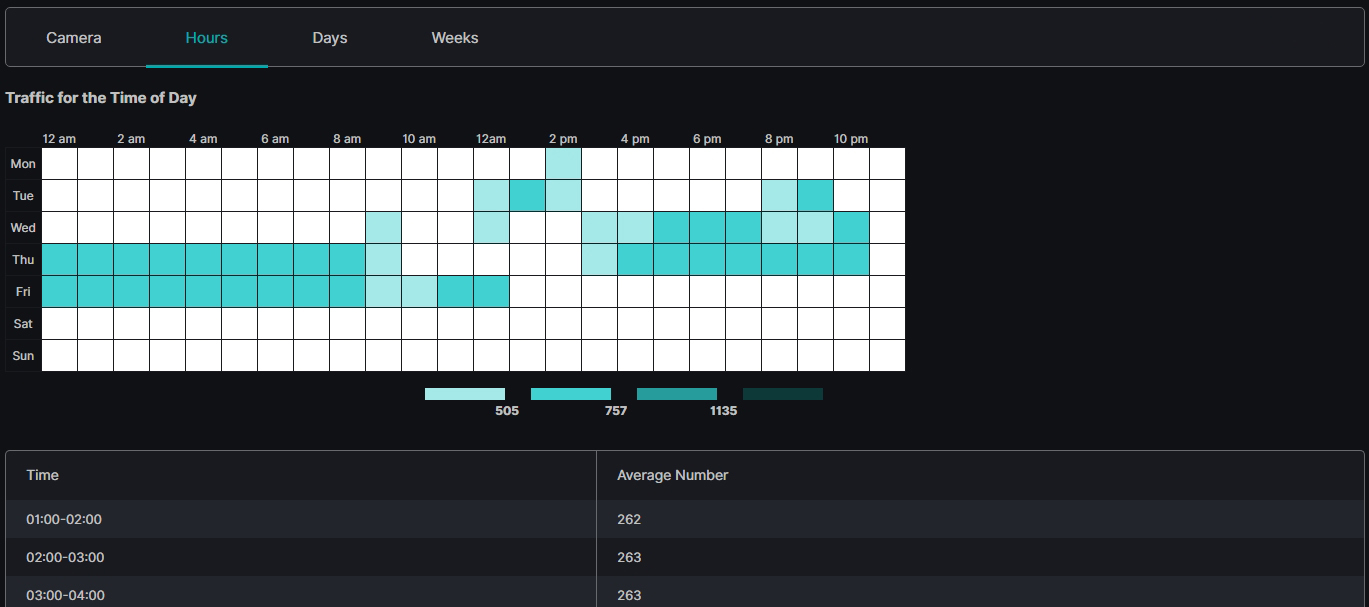
- Table chart with the number of the vehicles by hours and days of a week
- Table with Time and Average Number columns
Hover the mouse over the colored squares to see the found vehicle quantity for the required time interval.
Days Tab
The Days tab shows:
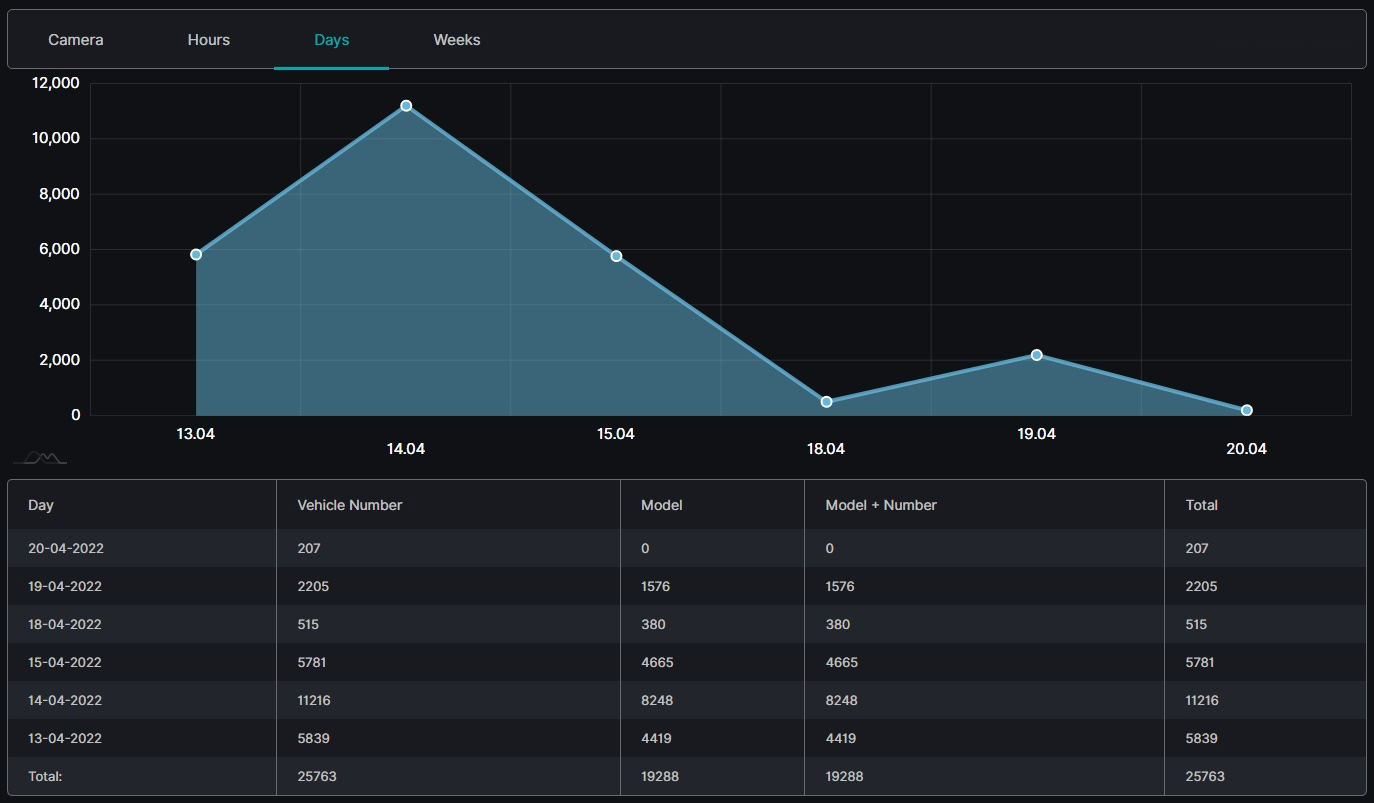
- Checkpoints on the area chart by found vehicle quantity and date
- Table columns by date, detected vehicle number and model, as well as their total number for a specific day or for a required time frame in general
Hover the mouse over the checkpoints to see the found vehicle quantity for a required date.
Weeks Tab
The Weeks tab shows:
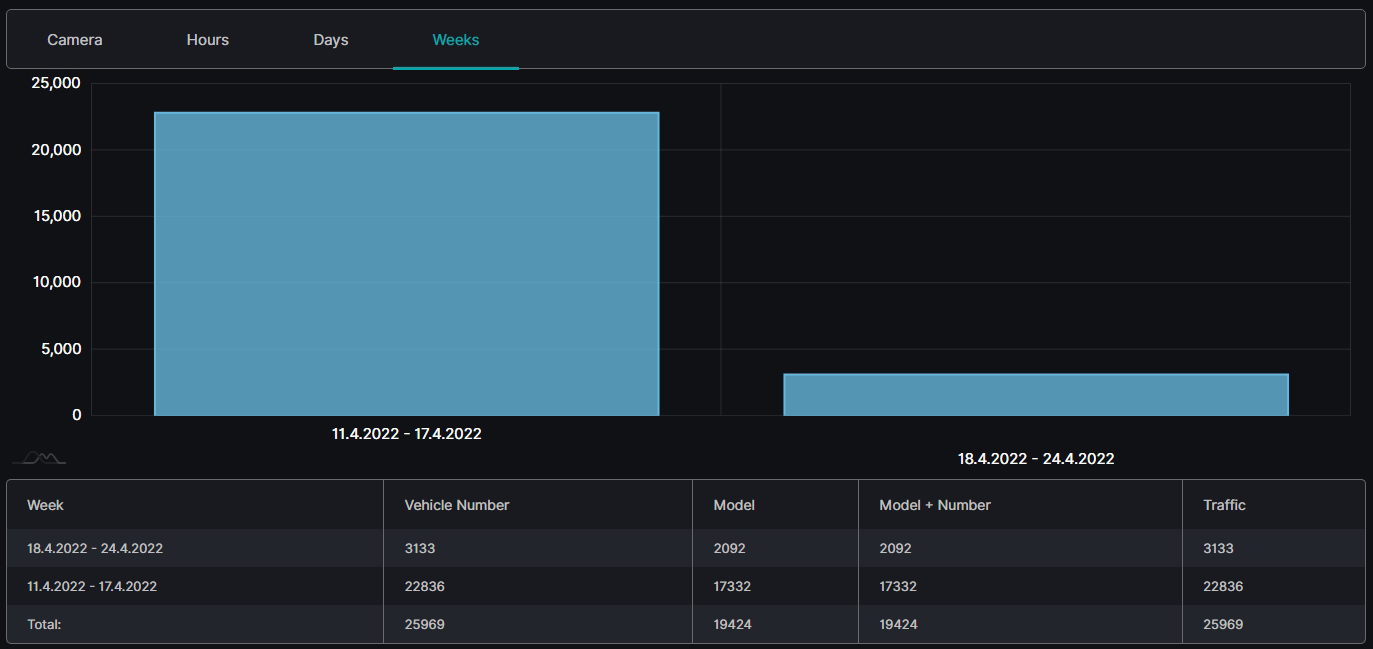
- Columns on the column chart with heights proportional to the vehicle quantity detected during the required weeks
- Table columns by weeks, detected vehicle number and model, as well as their total number for a specific week or for a required time frame in general
Hover the mouse over the chart columns to see the found vehicle quantity for a required week.